Chapter 59: The Measurement Problem |
1. Introduction: Why Measurement Is the Hardest Part of the AI Journey |
Throughout this book, we have examined how artificial intelligence is reshaping industries as varied as manufacturing, healthcare, education, finance, agriculture, logistics, entertainment, and public services. We have compared tools, explored adoption patterns, and traced the trajectories that might define the next decade. Yet as we arrive at this final part, we must confront a question that cuts across every sector and every tool: how do we know whether AI is actually working |
This is the measurement problem. It is not a minor accounting detail. It is the central challenge that determines whether organizations can sustain their AI investments, whether they can learn from their deployments, and whether they can convince boards, regulators, and the public that the technology deserves continued trust. The measurement problem is also deeply uneven. Some industries enjoy clear, quantifiable metrics that make return on investment relatively straightforward to calculate. Others operate in a fog of ambiguous outcomes, long time horizons, and multiple confounding factors. Understanding this uneven landscape is essential for anyone who wants to move beyond the hype cycle and build AI strategies that endure. |
The year 2026 has become a convenient shorthand for a broader phenomenon: the disillusionment trough. After several years of intense excitement, pilot projects, and ambitious promises, many organizations have found themselves asking why the expected transformations have not materialized. In some cases, the tools are genuinely underperforming. In many others, the tools are working but the organizations cannot prove it. The difficulty of attributing organizational outcomes to specific AI tools has become a self-reinforcing problem. Without measurement, there is no evidence. Without evidence, there is no confidence. Without confidence, there is no scaling. And without scaling, the promised benefits never arrive. |
This chapter argues that the measurement problem is not unsolvable, but it requires a more sophisticated approach than most organizations currently possess. We need frameworks that capture both direct efficiency gains and indirect capabilities. We need to accept that different industries require different measurement philosophies. And we need to recognize that the most important benefits of AI are often the ones that are hardest to quantify. |

|
2. The Asymmetry of Measurement Across Industries |
2.1 Manufacturing: The Gold Standard of Measurable AI |
Manufacturing has long been the poster child for measurable AI outcomes. This is not because manufacturing is simple, but because its processes are instrumented, repetitive, and closely tied to financial results. When an AI system is deployed on a production line, its impact can often be isolated with reasonable confidence. |
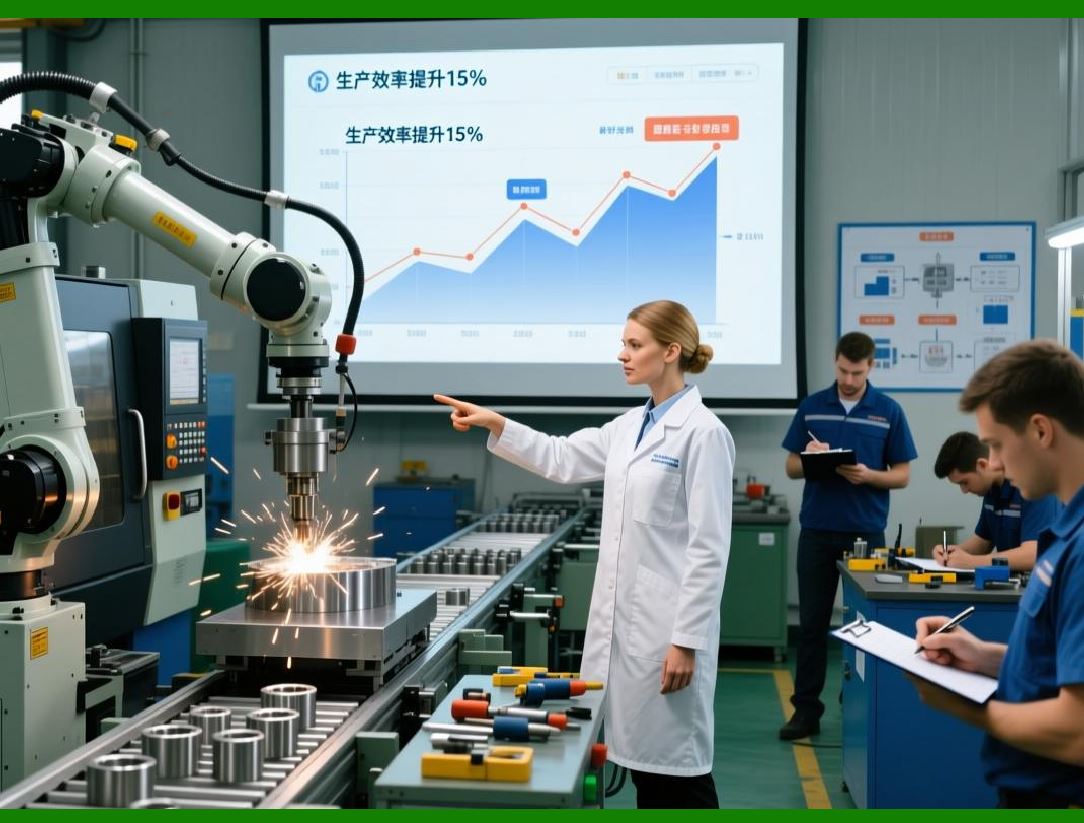
Consider predictive maintenance. A factory that installs sensors and machine learning models to predict equipment failures can measure success in several concrete ways. Unplanned downtime hours can be tracked before and after deployment. Maintenance costs can be compared across periods. The cost of spare parts inventory can be monitored. Production output can be measured against a baseline. If the AI system reduces unplanned downtime by twenty percent and saves two million dollars in maintenance costs over a year, that number is defensible. It can be audited. It can be presented to a CFO without embarrassment. |
Similarly, quality control offers clear metrics. Computer vision systems that detect defects on an assembly line can be evaluated by their false positive and false negative rates. The cost of scrap and rework can be measured. Customer returns can be tracked. Yield improvement, expressed as a percentage of usable products per batch, is a metric that every plant manager understands. |
Energy optimization is another area where manufacturing excels at measurement. AI systems that adjust heating, ventilation, and cooling in real time can reduce kilowatt-hour consumption. The savings appear directly on utility bills. Carbon emissions can be estimated from energy data. These are not perfect measurements, but they are concrete enough to justify investment. |
The reason manufacturing enjoys this advantage is not that AI is inherently more effective there. It is that the surrounding infrastructure makes measurement possible. Sensors are already in place. Processes are standardized. Financial accounting systems capture costs at a granular level. The feedback loop between action and outcome is short. When a machine fails, the failure is recorded. When a batch is scrapped, the scrap is counted. This instrumentation is the foundation of measurement, and manufacturing has been building it for decades. |
Even in manufacturing, however, measurement is not without complications. An AI system that optimizes one part of the line may create bottlenecks elsewhere. A predictive maintenance model may reduce downtime but increase the frequency of scheduled maintenance. The savings attributed to AI may overlap with savings from other initiatives, such as lean manufacturing or supplier renegotiations. Attribution remains a challenge, but it is a challenge that manufacturing is better equipped to address than most other sectors. |
|
2.2 Healthcare: Measuring Outcomes in a Sea of Confounders |
Healthcare presents a starkly different picture. The potential for AI is enormous, from diagnostic imaging to drug discovery to patient triage. But the measurement of ROI is fraught with difficulty. |
Consider an AI system designed to detect early signs of diabetic retinopathy from retinal images. The technical performance of the system can be measured with precision. Sensitivity, specificity, and area under the curve are standard metrics. But the organizational and clinical outcomes are far harder to isolate. Did the system lead to earlier treatmentDid earlier treatment prevent vision lossDid preventing vision loss improve the patient's quality of life, employment prospects, or mental healthEach of these questions involves a chain of causation that stretches over years and is influenced by countless factors, including patient adherence, access to follow-up care, and socioeconomic conditions. |
Even when outcomes can be measured, attribution is contentious. Suppose a hospital deploys an AI sepsis prediction tool and observes a reduction in sepsis mortality. Can that reduction be attributed to the AIOr was it due to a simultaneous training program for nursesOr a new antibiotic protocolOr a change in patient demographicsRandomized controlled trials can help, but they are expensive, slow, and sometimes ethically complicated. In many cases, hospitals must rely on observational data, which is vulnerable to bias and confounding. |
Financial measurement in healthcare is equally challenging. The payer system is fragmented. Savings may accrue to one party while costs are borne by another. An AI tool that prevents hospital readmissions may save money for an insurer but reduce revenue for a hospital. An AI tool that improves diagnostic accuracy may lead to more procedures, increasing short-term costs while improving long-term outcomes. The business case for AI in healthcare cannot be reduced to a simple cost-saving calculation. |
Furthermore, healthcare organizations often have missions that transcend profit. A public hospital may value equity, access, and patient experience alongside financial performance. These values are difficult to monetize. An AI system that reduces wait times in an emergency department may not generate direct revenue, but it may save lives and reduce suffering. How do we measure that |
The measurement problem in healthcare is not just a technical challenge. It is a philosophical one. It forces us to ask what we value and how we weigh competing priorities. AI can help us achieve those values, but only if we can articulate them clearly and measure them honestly. |

|
2.3 Education: The Long Horizon of Human Development |
Education shares many of healthcare's measurement difficulties, amplified by even longer time horizons. The ultimate goal of education is not a short-term output but a lifelong outcome: a productive, fulfilled, and engaged citizen. AI tools in education, from personalized tutoring systems to automated essay grading to early warning systems for dropouts, promise to improve that outcome. But proving it is extraordinarily difficult. |
Consider an AI-powered tutoring system used in a middle school mathematics class. The system can measure student engagement, time on task, and performance on practice problems. It can even measure improvement on standardized tests at the end of the year. But the ultimate question is whether the system helped students develop mathematical reasoning, confidence, and a lasting interest in the subject. These are not captured by test scores alone. And even if test scores improve, can we be sure the AI caused the improvementPerhaps the teacher was especially effective that year. Perhaps the students were unusually motivated. Perhaps the test itself changed. |
Longitudinal studies can track students over years, but they are expensive and suffer from attrition. Randomized controlled trials in education are possible but raise ethical concerns about withholding potentially beneficial tools from control groups. And the context matters enormously. A tool that works in a well-funded suburban school may fail in an under-resourced rural school. A tool that helps native speakers may confuse English language learners. Generalizing from one setting to another is dangerous. |
Financial measurement in education is also complicated. Schools and universities do not typically generate profit. Their funding comes from taxes, tuition, and donations. An AI system that reduces administrative costs may free up resources for instruction, but the link between administrative savings and student outcomes is indirect. An AI system that improves graduation rates may increase revenue from tuition, but only if the graduates would not have graduated anyway. The counterfactual is always uncertain. |
Perhaps the most important outcome of education is one that resists measurement entirely: the development of curiosity, critical thinking, and moral reasoning. These are the qualities that make a life worth living and a society worth sustaining. AI may support their development, but we may never be able to prove it with a number. This does not mean we should abandon measurement. It means we should complement quantitative metrics with qualitative evidence, stories, and expert judgment. |
|
2.4 Finance: High Stakes and High-Frequency Measurement |
Finance occupies a middle ground between manufacturing and healthcare. Like manufacturing, finance is instrumented and data-rich. Like healthcare, finance deals with complex, interdependent systems where attribution is difficult. |
Consider algorithmic trading. An AI system that executes trades can be evaluated with extreme precision. Execution speed, slippage, and transaction costs are measured in milliseconds and basis points. Profit and loss are calculated daily. If the system makes money, the ROI is clear. If it loses money, the ROI is equally clear. The feedback loop is short and the metrics are unambiguous. |
But not all AI in finance is so easily measured. Credit scoring models, for example, predict the likelihood of default. Their performance can be measured with statistical metrics like the Gini coefficient or the Kolmogorov-Smirnov statistic. But the broader impact on a bank's portfolio depends on macroeconomic conditions, regulatory changes, and competitive dynamics. A model that performs well in a stable economy may fail in a recession. A model that reduces defaults may also reduce approvals, hurting revenue. The trade-offs are complex. |
Fraud detection offers another example. An AI system that flags fraudulent transactions can be measured by its detection rate and its false positive rate. But the cost of a false positive is not just the inconvenience to the customer. It may be a lost sale, a damaged relationship, or a regulatory complaint. The cost of a false negative is a fraudulent charge, which may be reimbursed by the bank or absorbed by the merchant. The true ROI depends on how these costs are distributed, which varies by institution and by jurisdiction. |
Compliance and risk management are even harder to measure. An AI system that monitors employee communications for insider trading or misconduct may prevent a scandal that never happens. The absence of a scandal is not a measurable event. It is a counterfactual. How do you prove that a disaster was avoidedYou cannot. You can only argue that the risk was reduced, and that argument may not convince a skeptical board. |

|
2.5 Retail and E-commerce: The Illusion of Precision |
Retail and e-commerce appear to offer precise measurement. Every click, every view, every purchase is logged. AI systems that recommend products, optimize prices, or manage inventory can be evaluated with A/B tests. The difference in conversion rate between the control group and the treatment group is a direct measure of the AI's impact. This is the promise of digital measurement. |
But the precision is often illusory. A/B tests suffer from subtle biases. The treatment group may not be representative. The novelty effect may inflate short-term results. The metric being optimized may not be the metric that matters. A recommendation system that increases click-through rates may also increase returns, as customers buy products they later regret. A pricing system that maximizes short-term revenue may damage long-term customer loyalty. A inventory system that reduces stockouts may increase waste. |
Furthermore, the online and offline worlds are not separate. A customer who sees an AI-generated recommendation online may visit a physical store to make a purchase. The online system gets credit for a sale that might have happened anyway. Attribution across channels is a persistent headache. Multi-touch attribution models exist, but they are approximations at best. |
Small and medium-sized retailers often lack the data infrastructure to measure AI impact at all. They may adopt a chatbot or a inventory forecasting tool based on vendor promises, but they have no way to know whether it is working. The vendor may provide dashboards, but those dashboards are designed to show success, not to reveal failure. Independent measurement is rare. |

|
2.6 Agriculture: Measuring in the Field |
Agriculture is another industry where measurement is both possible and complicated. AI systems for precision farming can optimize irrigation, fertilization, and pest control. The results can be measured in crop yield, water usage, and input costs. These are concrete metrics that farmers understand. |
But agriculture is subject to weather, pests, and market prices that are beyond the farmer's control. A good harvest may be due to favorable weather, not the AI system. A bad harvest may be due to a drought, not a failure of the AI. Isolating the effect of AI requires controlled experiments, which are difficult to run on a working farm. Variable rate application of fertilizer can be tested on different plots, but the plots may differ in soil quality, drainage, and sunlight. Statistical techniques can adjust for these differences, but they require expertise and data that many farmers lack. |
The time horizon also matters. Some benefits of precision agriculture accrue over multiple seasons. Soil health improves slowly. Water tables recharge gradually. A one-year study may miss the long-term benefits. Conversely, a one-year study may overstate the benefits if the weather was unusually favorable. |
Finally, the adoption of AI in agriculture is often driven by factors other than ROI. A farmer may adopt a new tool because a trusted neighbor recommends it, because it reduces labor stress, or because it aligns with a personal commitment to sustainability. These motivations are real and important, but they are not easily captured in a financial calculation. |

|
2.7 Public Sector: Measuring What Matters to Citizens |
The public sector faces perhaps the most complex measurement challenge of all. Governments use AI for a wide range of purposes: predicting demand for services, detecting fraud in benefit programs, optimizing traffic flows, improving emergency response, and engaging citizens through chatbots. The outcomes that matter are not profits but public value: safety, equity, efficiency, and trust. |
Consider an AI system that predicts which families are at risk of child abuse or neglect. The system may help social workers prioritize cases. But how do we measure successIf the system prevents a tragedy, that is a success, but it is invisible. If the system flags a family that turns out to be safe, that is a false positive, which may cause unnecessary trauma. If the system misses a family that later suffers a tragedy, that is a false negative, which may destroy public trust. The trade-offs are moral, not just technical. |
Traffic optimization offers a clearer example. An AI system that adjusts traffic signals in real time can reduce average commute times. That is a measurable outcome. It can also reduce emissions, which can be estimated from fuel consumption. But the distribution of benefits matters. If the system favors wealthier neighborhoods with more cars, it may worsen equity. If it prioritizes buses, it may improve public transit but slow down private vehicles. The measurement framework must capture these distributional effects, not just the average. |
Public sector measurement is also complicated by political cycles. A program that produces benefits over ten years may be canceled after two because the current administration wants quick results. AI investments may be judged by whether they produce visible wins before the next election. This short-termism is a barrier to effective measurement and to the adoption of AI itself. |
|
3. The Disillusionment Trough of 2026 |
3.1 What Happened |
The disillusionment trough of 2026 did not happen because AI stopped working. It happened because the gap between expectation and evidence became too wide to ignore. In the years leading up to 2026, organizations across every industry launched pilots, created innovation labs, and hired data scientists. The promises were expansive: transform the business, disrupt the industry, achieve unprecedented efficiency. The results were often modest, ambiguous, or invisible. |
Several factors contributed to this gap. First, many organizations underestimated the difficulty of integrating AI into existing workflows. A model that performs well in a laboratory may fail in production because the data is messier, the users are resistant, or the process is more complex than anticipated. Second, many organizations lacked the infrastructure to measure impact. They could deploy a tool but could not tell whether it was working. Third, the benefits of AI are often indirect and long-term, while the costs are direct and immediate. The CFO sees the invoice from the vendor. The CFO does not see the improved decision that never happened because the AI was not there. Fourth, the hype cycle itself created unrealistic expectations. When the results did not match the hype, the reaction was predictable. |
3.2 The Attribution Problem |
At the heart of the disillusionment trough is the attribution problem. Organizations struggle to attribute outcomes to specific AI tools. This is not a new problem. It has plagued information technology investments for decades. But AI amplifies it because AI is often embedded in larger systems, because its effects are probabilistic rather than deterministic, and because it interacts with human decision-makers in unpredictable ways. |
Consider a hospital that deploys an AI tool for early detection of sepsis. The tool alerts nurses when a patient's vital signs suggest impending sepsis. The nurses then decide whether to act on the alert. The outcome depends on the tool's accuracy, the nurses' trust in the tool, the nurses' workload, the availability of antibiotics, and the patient's underlying health. If the mortality rate falls, how much of the credit goes to the AIIf the mortality rate does not fall, how much of the blame goes to the AIThere is no simple answer. |
Attribution is further complicated by the fact that AI tools are often deployed alongside other changes. A retail company might simultaneously adopt a new AI-powered inventory system, reorganize its supply chain, and launch a new marketing campaign. If sales increase, which change deserves the creditIf sales decrease, which change is at faultWithout careful experimental design, the organization cannot know. |
3.3 The Pressure to Show Results |
The disillusionment trough also reflects the pressure to show results. AI investments are often justified with optimistic projections. When those projections are not met, the pressure to demonstrate value becomes intense. This pressure can lead to gaming the metrics, cherry-picking success stories, or abandoning AI altogether. None of these responses is healthy. |
The pressure to show results is particularly acute in publicly traded companies, where quarterly earnings reports drive decision-making. AI investments that pay off over years may be cut because they do not show returns within months. The same dynamic affects government agencies, where budget cycles are annual and political attention spans are short. |

|
4. What Makes Measurement So Hard |
4.1 Complexity and Interdependence |
The first reason measurement is hard is complexity. Modern organizations are complex systems. AI tools are embedded in these systems and interact with other tools, processes, and people. The effects of an AI tool ripple through the system in ways that are difficult to predict or trace. |
Consider a logistics company that uses AI to optimize delivery routes. The AI reduces fuel consumption and delivery times. But it also changes the workload of drivers, the schedule of warehouse workers, and the expectations of customers. Some of these effects are positive. Some are negative. Some are indirect. Measuring the full impact requires a systems perspective that most organizations lack. |
4.2 Time Lags |
The second reason is time lags. Many benefits of AI accrue slowly. A predictive maintenance system may take months to collect enough data to be accurate. A personalized learning system may take years to show effects on graduation rates. A fraud detection system may prevent losses that would have occurred in the future, which is a counterfactual that cannot be observed. |
Time lags create a mismatch between the timing of costs and the timing of benefits. Costs are incurred upfront. Benefits arrive later. This mismatch makes AI investments look worse in the short term than they actually are. |
4.3 Confounding Factors |
The third reason is confounding factors. Organizations are not laboratories. Many things change at once. A new CEO, a recession, a competitor's move, a regulatory change, a natural disaster: any of these can affect outcomes. Isolating the effect of AI requires controlling for these factors, which is often impossible. |
Statistical techniques can help. Randomized controlled trials, difference-in-differences, instrumental variables, and propensity score matching are all tools for causal inference. But they require data, expertise, and sometimes ethical compromises. Many organizations lack these resources. |
4.4 The Problem of Counterfactuals |
The fourth reason is the problem of counterfactuals. To measure the impact of AI, you need to know what would have happened without it. But you cannot observe the counterfactual. You can only estimate it. The estimate may be wrong. |
This is why randomized controlled trials are considered the gold standard. By randomly assigning some units to treatment and others to control, you can estimate the counterfactual with confidence. But randomization is not always possible or ethical. In healthcare, you cannot randomly deny a potentially life-saving AI tool to some patients. In education, you cannot randomly assign some students to a worse learning environment. In business, you may not want to deny a potentially profitable tool to some customers. |
4.5 Human Factors |
The fifth reason is human factors. AI tools are used by people. People may trust the tool too much or too little. They may use it in ways the designers did not intend. They may resist it or embrace it. These human factors affect outcomes in ways that are difficult to measure. |
Consider an AI system that recommends which job candidates to interview. If hiring managers ignore the recommendations, the system will have no effect. If they follow the recommendations blindly, the system may perpetuate biases. Measuring the impact of the system requires measuring not just the outcomes but also the behavior of the users. This is social science, not just data science. |

|
5. Frameworks for Measuring AI ROI |
5.1 The Balanced Scorecard Approach |
One useful framework is the balanced scorecard, adapted for AI. The balanced scorecard, developed by Kaplan and Norton, encourages organizations to measure performance across multiple perspectives: financial, customer, internal process, and learning and growth. For AI, this means measuring not just cost savings and revenue gains but also customer satisfaction, process efficiency, and organizational capabilities. |
The financial perspective captures direct efficiency gains: reduced downtime, lower maintenance costs, increased sales. The customer perspective captures changes in customer experience: faster service, personalized recommendations, fewer errors. The internal process perspective captures improvements in operations: shorter cycle times, higher quality, better compliance. The learning and growth perspective captures the development of new capabilities: data literacy, experimentation culture, AI skills. |
The advantage of the balanced scorecard is that it acknowledges multiple dimensions of value. The disadvantage is that it can become a checklist exercise, with metrics that are easy to measure crowding out metrics that are important but hard to measure. |
5.2 The Capability Approach |
A complementary framework is the capability approach. Instead of asking 'What did AI produce' this framework asks 'What can the organization now do that it could not do before' The focus is on capabilities, not outputs. |
For example, an AI system that predicts equipment failures gives the organization the capability to move from reactive to proactive maintenance. That capability may not show up immediately in cost savings, but it changes the organization's strategic options. It can offer new service contracts. It can reduce risk. It can improve customer trust. |
The capability approach is particularly useful for measuring indirect benefits. It recognizes that AI is not just a tool for cutting costs but a tool for building new competencies. These competencies may take years to pay off, but they are the foundation of long-term competitiveness. |
5.3 The Theory of Change Approach |
A third framework is the theory of change. This approach starts with the desired outcome and works backward to identify the inputs, activities, outputs, and intermediate outcomes that are necessary to achieve it. It makes explicit the assumptions and causal links that connect AI to the ultimate goal. |
For example, a hospital that wants to reduce sepsis mortality might develop a theory of change. The inputs include the AI tool, the training program, and the data infrastructure. The activities include deploying the tool, training nurses, and integrating the tool into the workflow. The outputs include alerts generated, alerts acted upon, and patients treated. The intermediate outcomes include earlier detection, faster treatment, and reduced mortality. The ultimate outcome is saved lives. |
The theory of change helps organizations identify where measurement should focus. It also helps them recognize when the causal chain breaks. If the AI tool generates alerts but nurses do not act on them, the problem is not the tool but the workflow. Measurement can reveal this. |
5.4 The Multi-Level Measurement Approach |
A fourth framework is multi-level measurement. AI impact can be measured at the individual, team, organizational, and societal levels. Each level has different metrics and different time horizons. |
At the individual level, metrics might include task completion time, error rates, and user satisfaction. At the team level, metrics might include collaboration quality, decision speed, and conflict resolution. At the organizational level, metrics might include productivity, profitability, and market share. At the societal level, metrics might include employment, equity, and environmental impact. |
Multi-level measurement recognizes that AI can have effects at one level that are invisible at another. A tool that improves individual productivity may reduce team morale. A tool that increases organizational profit may worsen societal inequality. Measuring only one level gives a partial picture. |

|
6. Practical Steps for Organizations |
6.1 Start with a Clear Question |
The first step in measuring AI ROI is to ask a clear question. What are you trying to achieveWhat decision will the measurement informWhat would you do differently if you knew the answerWithout a clear question, measurement becomes a fishing expedition. |
A clear question might be: 'Did the AI-powered chatbot reduce customer service costs without reducing customer satisfaction' Or: 'Did the predictive maintenance system reduce unplanned downtime by at least ten percent' Or: 'Did the personalized learning system improve math scores for struggling students' |
The question should be specific, measurable, and tied to a decision. It should also acknowledge the counterfactual: compared to what |
6.2 Define Metrics Before Deployment |
The second step is to define metrics before deployment. This is essential. If you wait until after deployment to decide what to measure, you will be tempted to measure what is easy rather than what is important. You will also lack baseline data. |
Baseline data is the measurement of the current state before AI is introduced. Without a baseline, you cannot know whether things improved. Baseline data should be collected over a sufficient period to account for normal variation. It should include the metrics you care about and the factors that might confound them. |
6.3 Use Control Groups When Possible |
The third step is to use control groups when possible. A control group is a set of users, processes, or locations that do not receive the AI tool. By comparing the treatment group to the control group, you can estimate the AI's impact. |
Control groups are not always feasible. But when they are, they are invaluable. They transform measurement from speculation to evidence. They also protect against the temptation to claim credit for improvements that would have happened anyway. |
6.4 Combine Quantitative and Qualitative Methods |
The fourth step is to combine quantitative and qualitative methods. Numbers tell part of the story. Stories tell the rest. Interviews, focus groups, and ethnographic observation can reveal why a tool is working or not working. They can surface unintended consequences. They can capture the human experience of AI in ways that metrics cannot. |
Qualitative methods are often dismissed as soft or unscientific. This is a mistake. Qualitative evidence can be rigorous and systematic. It can challenge assumptions and generate hypotheses. It is essential for understanding complex systems. |
6.5 Measure Indirect Benefits |
The fifth step is to measure indirect benefits. These are the benefits that do not show up in direct cost savings or revenue gains. They include improved decision quality, increased innovation, better employee morale, and enhanced organizational learning. |
Indirect benefits are hard to measure, but they are not impossible. Surveys can measure employee confidence and job satisfaction. Innovation can be measured by the number of new ideas generated or patents filed. Decision quality can be measured by the accuracy of forecasts or the speed of response to changing conditions. Organizational learning can be measured by the rate at which best practices spread. |
6.6 Be Honest About Uncertainty |
The sixth step is to be honest about uncertainty. Measurement is never perfect. There are always error bars. There are always assumptions. There are always things you do not know. |
Being honest about uncertainty builds trust. It also encourages learning. If you pretend to know more than you do, you will make bad decisions. If you acknowledge what you do not know, you can design experiments to find out. |
6.7 Iterate and Improve |
The seventh step is to iterate and improve. Measurement is not a one-time event. It is a continuous process. As the AI system learns and evolves, so should the measurement framework. As the organization learns, so should its questions. |
Iteration requires a culture of experimentation. It requires tolerance for failure. It requires a willingness to change course based on evidence. These are cultural attributes, not technical ones. They are often the hardest to develop. |

|
7. Case Studies in Measurement |
7.1 Manufacturing: Predictive Maintenance at a Steel Plant |
A steel plant in the Midwest deployed an AI system to predict failures in its rolling mill. The system used vibration sensors, temperature sensors, and historical maintenance records to forecast when bearings would fail. The plant defined its metrics before deployment: unplanned downtime hours, maintenance cost per ton, and spare parts inventory. It also established a control group by deploying the system on two of its four production lines first. |
After twelve months, the plant found that unplanned downtime on the treatment lines had fallen by twenty-five percent. Maintenance costs had fallen by fifteen percent. Spare parts inventory had fallen by ten percent. The control lines showed no significant change. The plant also conducted interviews with maintenance workers, who reported that they trusted the system and found it useful. The ROI was clear and defensible. |
7.2 Healthcare: Sepsis Detection at a Community Hospital |
A community hospital deployed an AI system to detect early signs of sepsis. The hospital defined its metrics: time to antibiotic administration, sepsis mortality rate, and length of stay. It did not use a control group because it believed it was unethical to withhold a potentially life-saving tool. Instead, it used a before-and-after design with statistical controls for patient characteristics. |
After eighteen months, the hospital found that time to antibiotic administration had fallen by thirty minutes. Sepsis mortality had fallen by five percent. Length of stay had fallen by one day. However, the hospital also found that nurses were experiencing alert fatigue. The system generated many false positives, and nurses were spending time on patients who did not have sepsis. The hospital adjusted the threshold and added a secondary review step. The measurement framework captured both the benefits and the costs. |
7.3 Education: Personalized Learning in a Large Urban District |
A large urban school district deployed an AI-powered personalized learning system in its middle schools. The district defined its metrics: math and reading test scores, student engagement, and teacher satisfaction. It used a matched comparison design, pairing schools that adopted the system with similar schools that did not. |
After two years, the district found that math scores had improved modestly in the treatment schools. Reading scores showed no significant change. Student engagement, measured by time on task and attendance, had improved. Teacher satisfaction was mixed. Some teachers found the system helpful. Others found it burdensome. The district also conducted focus groups with students, who reported that the system was helpful but sometimes boring. The measurement framework revealed a nuanced picture that a simple test score comparison would have missed. |
7.4 Finance: Fraud Detection at a Regional Bank |
A regional bank deployed an AI system to detect credit card fraud. The bank defined its metrics: fraud detection rate, false positive rate, and customer satisfaction. It used a control group by deploying the system on a subset of accounts first. |
After six months, the bank found that the fraud detection rate had increased by twenty percent. The false positive rate had increased by five percent. Customer satisfaction had fallen slightly, as some customers were inconvenienced by declined transactions. The bank adjusted the system to reduce false positives, accepting a slightly lower detection rate. The measurement framework helped the bank find the right balance. |
7.5 Retail: Inventory Optimization at a National Chain |
A national retail chain deployed an AI system to optimize inventory across its stores. The chain defined its metrics: stockouts, excess inventory, and sales. It used a control group by deploying the system in half of its regions first. |
After one year, the chain found that stockouts had fallen by fifteen percent. Excess inventory had fallen by ten percent. Sales had increased by two percent. The chain also found that the system worked better in some regions than others. Stores with more variable demand saw larger benefits. Stores with stable demand saw smaller benefits. The measurement framework helped the chain decide where to expand the system. |
7.6 Agriculture: Precision Irrigation on a Family Farm |
A family farm deployed an AI system to optimize irrigation. The farm defined its metrics: water usage, crop yield, and energy costs. It did not use a control group because the farm was too small. Instead, it compared its results to historical averages and to neighboring farms. |
After one season, the farm found that water usage had fallen by twenty percent. Crop yield had increased by five percent. Energy costs had fallen by ten percent. The farm also found that the system required more management attention than expected. The farmer had to check the system regularly and adjust the settings. The measurement framework captured both the savings and the additional labor. |
7.7 Public Sector: Traffic Optimization in a Mid-Sized City |
A mid-sized city deployed an AI system to optimize traffic signals. The city defined its metrics: average commute time, emissions, and bus ridership. It used a control group by deploying the system in half of the city first. |
After one year, the city found that average commute time had fallen by ten percent. Emissions had fallen by five percent. Bus ridership had increased by three percent. The city also found that the benefits were not evenly distributed. Wealthier neighborhoods saw larger reductions in commute time than poorer neighborhoods. The measurement framework revealed an equity concern that the city had not anticipated. |

|
8. The Role of Culture in Measurement |
8.1 Psychological Safety |
Measurement requires honesty. Honesty requires psychological safety. If people are afraid to report bad news, the measurement will be biased. If people are punished for failed experiments, they will stop experimenting. If people are rewarded for looking good rather than being good, they will game the metrics. |
Psychological safety is the belief that you can speak up without being punished. It is essential for learning. Organizations that lack psychological safety will struggle to measure AI ROI because they will not get accurate data. |
8.2 Learning Orientation |
Measurement requires a learning orientation. The purpose of measurement is not to judge but to learn. It is to understand what works, what does not, and why. Organizations that treat measurement as a tool for accountability will get compliance. Organizations that treat measurement as a tool for learning will get insight. |
A learning orientation means being willing to change course based on evidence. It means being willing to admit mistakes. It means being willing to invest in measurement even when the results are uncertain. |
8.3 Patience |
Measurement requires patience. The most important benefits of AI may take years to materialize. Organizations that expect immediate results will be disappointed. Organizations that are patient will be rewarded. |
Patience is difficult in a world of quarterly earnings and annual budgets. But it is essential. The organizations that succeed with AI will be those that can balance short-term pressures with long-term vision. |

|
9. The Future of Measurement |
9.1 Automated Measurement |
The future of measurement may be automated. As AI systems become more sophisticated, they may be able to measure their own impact. They may be able to track outcomes, identify confounders, and estimate counterfactuals in real time. This would reduce the burden on human analysts and make measurement more continuous. |
Automated measurement raises its own challenges. Who designs the algorithms that decide what to measureWho audits them for biasWho ensures that they are aligned with human valuesThese are questions that will become more pressing as automation spreads. |
9.2 Standardized Metrics |
The future of measurement may also include standardized metrics. Just as financial accounting has standard metrics like return on equity and earnings per share, AI measurement may develop standard metrics that allow comparison across organizations and industries. This would make it easier for investors, regulators, and the public to evaluate AI investments. |
Standardized metrics are difficult to develop because contexts differ. A metric that works for manufacturing may not work for healthcare. A metric that works for a large company may not work for a small one. But the effort to develop standards is worthwhile. It would bring discipline and transparency to a field that currently lacks both. |
9.3 Participatory Measurement |
The future of measurement may be more participatory. Instead of measuring AI impact from the top down, organizations may involve stakeholders in defining what to measure. Patients, students, workers, and citizens may have a say in what outcomes matter. This would make measurement more democratic and more aligned with human needs. |
Participatory measurement is challenging. It requires time, resources, and a willingness to share power. But it is essential for building trust. People are more likely to accept AI if they have a voice in how it is evaluated. |
9.4 Measurement as a Competitive Advantage |
Finally, the future of measurement may see measurement become a competitive advantage. Organizations that can measure AI ROI effectively will be able to invest more wisely, learn faster, and build trust more easily. They will outperform organizations that cannot. |
This is already happening in some industries. Manufacturers that have invested in instrumentation and data infrastructure are seeing faster returns on AI. Retailers that have built experimentation platforms are able to test and learn more quickly. Hospitals that have invested in clinical data warehouses are able to evaluate AI tools more rigorously. Measurement is not just a technical function. It is a strategic capability. |

|
10. Conclusion: Measuring What Matters |
The measurement problem is not a distraction from the real work of AI. It is the real work. Without measurement, AI is an act of faith. With measurement, it is an act of engineering. |
The challenges are real. Attribution is difficult. Time lags are long. Confounders are many. Counterfactuals are unobservable. Human factors are unpredictable. But these challenges are not insurmountable. They require frameworks that capture both direct efficiency gains and indirect capabilities. They require metrics that are defined before deployment and measured against baselines. They require control groups when possible and qualitative methods when necessary. They require honesty about uncertainty and a culture of learning. |
Different industries will solve the measurement problem in different ways. Manufacturing will continue to lead with clear, quantifiable metrics. Healthcare and education will develop more sophisticated frameworks that capture long-term outcomes and human values. Finance will balance precision with complexity. Retail will move beyond the illusion of precision. Agriculture will measure in the field. The public sector will measure what matters to citizens. |
The disillusionment trough of 2026 is a wake-up call. It is a reminder that hype is not evidence and that promises are not results. But it is also an opportunity. Organizations that take measurement seriously will emerge from the trough stronger and wiser. They will be the ones that scale AI successfully. They will be the ones that build trust with customers, employees, and the public. They will be the ones that turn AI from a shiny object into a durable source of value. |
In the chapters that follow, we will explore what this means for the future of AI across industries. We will consider how measurement frameworks will evolve, how they will be standardized, and how they will be used to guide investment and policy. We will also consider the limits of measurement, the things that cannot be counted, and the importance of judgment, wisdom, and values. |
For now, the essential message is this: measure what matters. Do not measure what is easy. Do not measure what looks good. Measure what tells you whether AI is making a difference in the lives of the people you serve. That is the only measurement that ultimately matters. |
 cs@easiersoft.com