With Excel, you can work with data in different ways, like sorting, calculating, and displaying it. However, big data, which is data that has a lot of size, speed, variety, and demands low-cost and original methods to deal with and understand it, is not suitable for Excel. | 
| Some of the limitations of Excel for big data are: | Excel can only store up to 1,048,576 rows and 16,384 columns of data per worksheet. Big data often exceeds this capacity and needs to be split into multiple files or sheets, which makes it harder to manage and analyze. | Excel is not very efficient at processing large amounts of data, especially if you use complex formulas, functions, or macros. It can take a long time to calculate, refresh, or update the data, and it can also crash or freeze if the data is too big. | Excel is not very scalable or flexible for big data. It does not support parallel or distributed computing, which means you cannot leverage the power of multiple machines or cloud services to handle big data. It also does not have built-in features to handle different types of data, such as unstructured, semi-structured, or streaming data. | 
| As a result, for dealing with big data, you may require other tools or technologies that are more fitting for big data, such as: | Pivot Tables: Pivot Tables are a feature of Excel that can help you summarize, aggregate, and analyze large data sets in Excel. You can drag and drop the data fields to create different views and reports of your data. You can also use slicers and timelines to filter and slice your data by different criteria. | 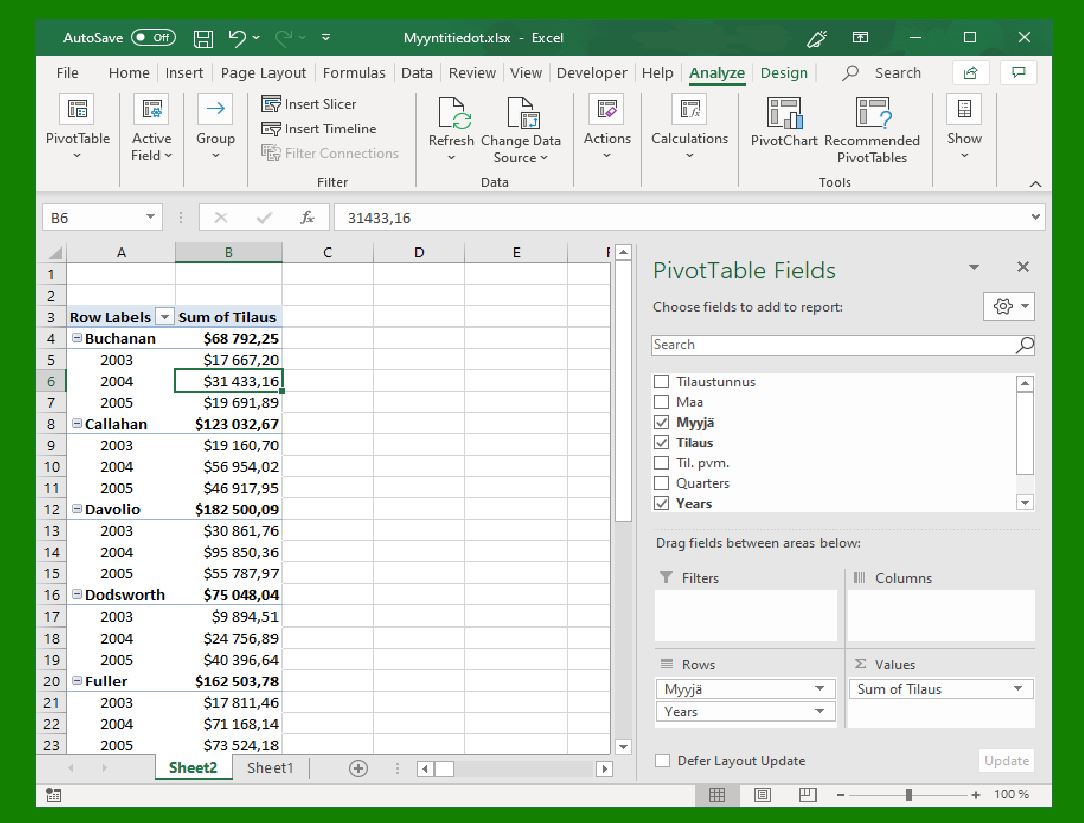
| Power Query: Power Query is an add-in for Excel that can help you connect, transform, and load data from various sources, such as databases, files, web pages, or APIs. You can use Power Query to clean, reshape, and combine data from different sources, and then load it into Excel or Power Pivot for further analysis. | 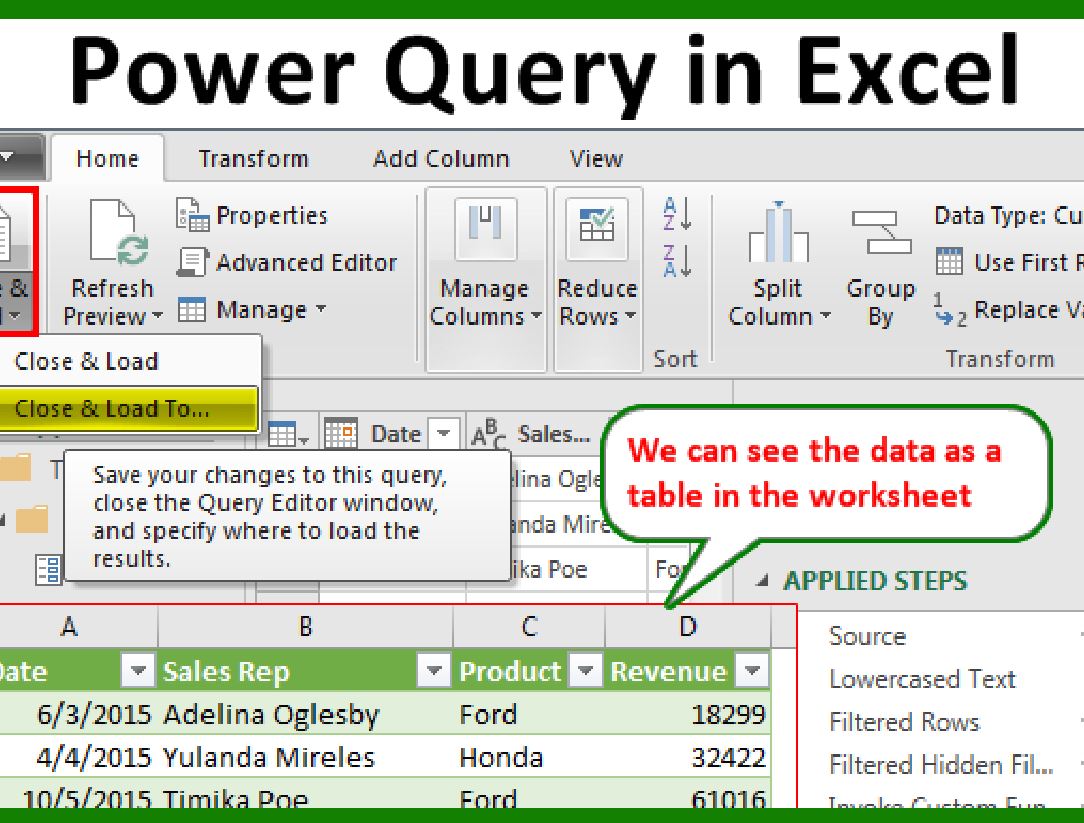
| Power Pivot: Power Pivot is another add-in for Excel that can help you create data models and perform advanced calculations on large data sets in Excel. You can use Power Pivot to create relationships between different tables of data, and then use DAX (Data Analysis Expressions) to create measures and calculated columns. You can also use Power Pivot to create Pivot Tables and Pivot Charts based on your data model. | 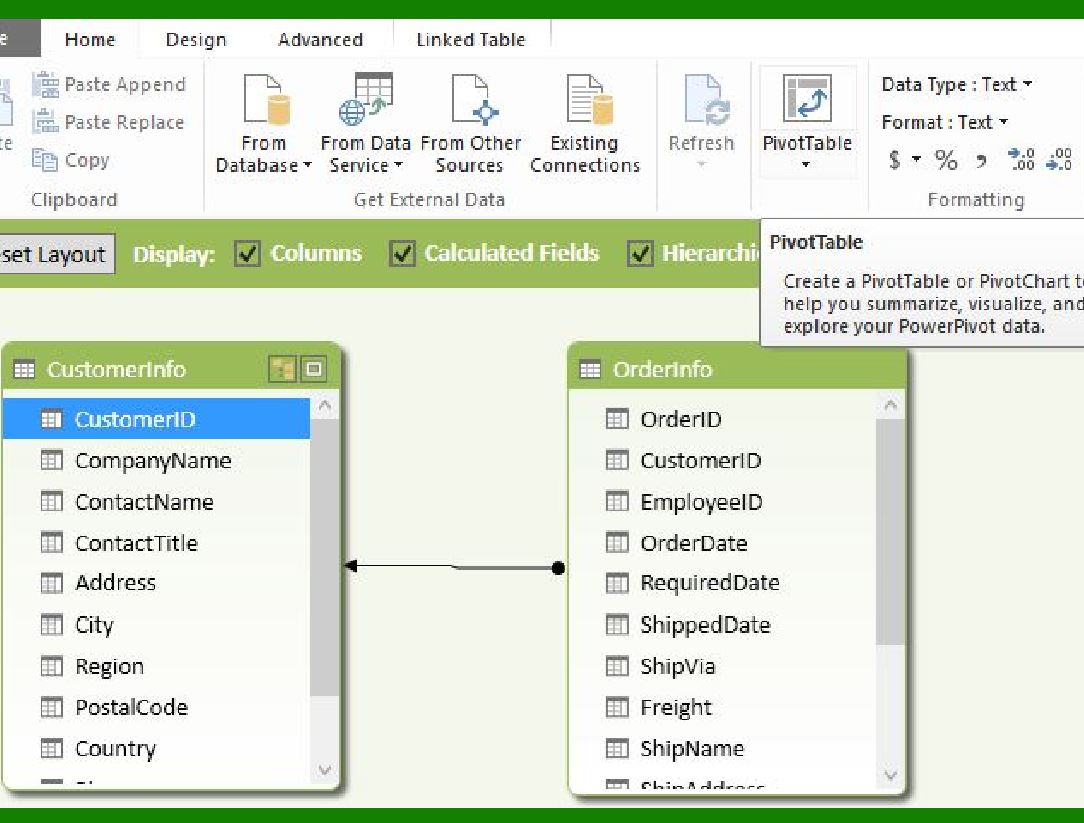
| Power BI: Power BI is a cloud-based service that can help you create interactive dashboards and reports from your data. You can use Power BI to connect to various data sources, such as Excel, databases, files, web pages, or APIs. You can also use Power BI to transform, model, and visualize your data using various charts, maps, tables, and other elements. You can also share and collaborate on your dashboards and reports with others online. | 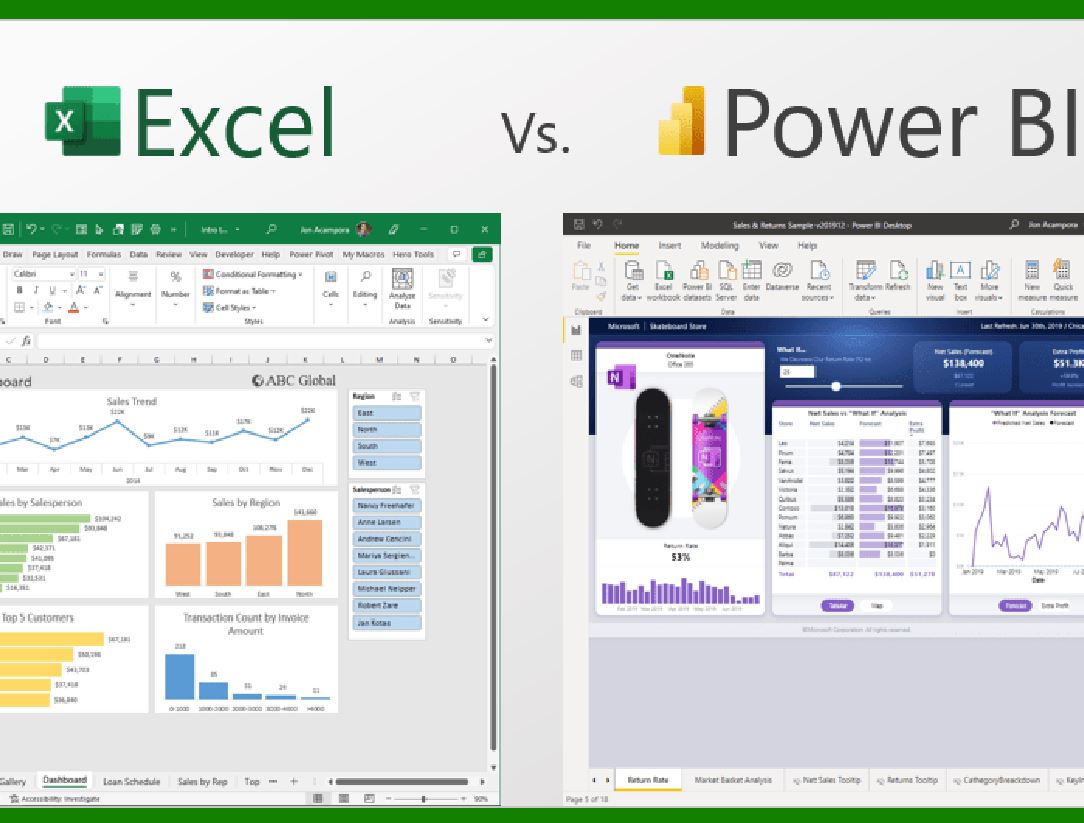
|
|
 cs@easiersoft.com