Intensive Care Unit (ICU) Monitoring - Continuous Vigilance: How American Hospitals Keep the Sickest Patients Alive with Data, Alarms, and Human Expertise |
Short Executive Summary |
This chapter explores the Intensive Care Unit (ICU) Monitoring system---the most data-intensive and life-critical module within the Hospital Information System. The ICU is the hospital's high-stakes arena, where the sickest patients receive round-the-clock, one-on-one (or one-on-two) nursing care, supported by a cascade of continuous physiological monitors, ventilators, infusion pumps, and life-support devices. The ICU monitoring system is the digital nervous system that captures, integrates, analyzes, and displays this torrent of data, turning raw waveforms and numbers into actionable clinical intelligence. Through detailed U.S. case studies---from a large academic medical center's quaternary ICU to a community hospital's mixed medical-surgical ICU and a rural critical-access facility's telehealth-supported ICU---we examine how ICU monitoring systems have evolved from simple waveform displays to sophisticated predictive platforms. The chapter covers the core components: bedside monitors, central monitoring stations, ventilator integration, infusion pump integration, early warning scores, and the electronic flowsheet. It explores the challenges of alarm fatigue, data overload, and the delicate balance between technology and human intuition. It also addresses the emerging role of artificial intelligence in predicting deterioration, the use of continuous EEG and hemodynamic monitoring, and the integration of ICU data with the broader EHR. It concludes that ICU monitoring is not merely about watching numbers; it is about creating a continuous, vigilant presence that gives clinicians the power to anticipate, prevent, and respond to life-threatening events before they become irreversible. |

|
Intensive Care Unit (ICU) Monitoring - Continuous Vigilance |
A Detailed Popular-Science Exploration |
1. The High-Stakes Arena |
The Intensive Care Unit (ICU) is the high-stakes arena of the hospital. It is where the sickest patients are brought---those with failing hearts, lungs, kidneys, or brains. It is a place of continuous vigilance, where the margin between life and death can be measured in minutes or even seconds. |
In a typical U.S. ICU, a single patient is connected to a dozen or more monitoring devices: a bedside monitor that tracks heart rate, blood pressure, oxygen saturation, and respiratory rate; a ventilator that breathes for them; an infusion pump that delivers life-sustaining medications; a dialysis machine that cleans their blood; and sometimes an intra-aortic balloon pump or an external ventricular drain. These devices generate a torrent of data---waveforms, numbers, alarms, and trends---that must be interpreted, integrated, and acted upon. |
The ICU monitoring system is the digital nervous system that captures this data, integrates it, and presents it to clinicians in a meaningful way. It is not a single system but a network of interconnected devices, servers, and displays that work together to provide continuous vigilance. It is the foundation of the ICU's ability to keep the sickest patients alive. |
This chapter will take you inside the ICU monitoring system of a modern American hospital. We will explore how it works, how it is used, and how it is evolving to become more predictive and less intrusive. We will also address the challenges of alarm fatigue and data overload, which are among the most pressing issues in critical care today. |

|
2. The Evolution of ICU Monitoring in the U.S. |
The history of ICU monitoring is a story of technological innovation driven by the recognition that critically ill patients need continuous, specialized observation. |
The pre-ICU era (pre-1960s): Before ICUs, the sickest patients were cared for on general medical-surgical wards. They were checked intermittently (every 4 hours or more). There was no continuous monitoring. A patient could deteriorate significantly between checks. |
The birth of the ICU (1960s-1970s): The first ICUs emerged in the U.S. in the 1960s, driven by advances in mechanical ventilation and cardiac surgery. These early ICUs had basic monitoring---a single-channel oscilloscope displaying the EKG, a blood pressure cuff, and a thermistor for temperature. Documentation was manual, on paper flowsheets. |
The digital revolution (1980s-1990s): The introduction of microprocessors allowed for more sophisticated monitoring. Bedside monitors could display multiple waveforms, calculate derived parameters (e.g., cardiac output), and store trends. The first electronic ICU flowsheets emerged, replacing the paper charts. |
The integrated era (2000s-present): Today's ICU monitoring systems are fully integrated with the EHR. Data from bedside monitors, ventilators, infusion pumps, and other devices is automatically captured and stored in the patient's electronic record. Central monitoring stations allow remote surveillance. Clinical decision support (CDS) systems analyze the data and generate alerts. |
The AI era (emerging): The newest ICU monitoring systems use artificial intelligence and machine learning to predict patient deterioration, identify patterns that are invisible to the human eye, and reduce false alarms. They are moving from being reactive (alerting when something is wrong) to being proactive (alerting before something goes wrong). |
|
3. The Core Components of ICU Monitoring |
A comprehensive ICU monitoring system includes several key components. |
Bedside Monitors: |
The bedside monitor is the most visible component. It is a sophisticated computer that displays the patient's vital signs and waveforms in real time. It typically includes: |
EKG (electrocardiogram): Displays the electrical activity of the heart. It shows the heart rate, the rhythm, and any abnormalities (e.g., arrhythmias, ST-segment changes). |
Non-invasive blood pressure (NIBP): Measures blood pressure using an automated cuff, typically every 15 to 30 minutes. |
Invasive blood pressure (IBP): Measures blood pressure directly from an arterial line (an indwelling catheter in an artery). This provides continuous, beat-to-beat blood pressure data. |
Pulse oximetry (SpO2): Measures the oxygen saturation of the blood using a sensor on the finger or earlobe. |
Respiratory rate: Displays the number of breaths per minute, often measured via impedance plethysmography (using the EKG electrodes) or via the ventilator. |
Temperature: Displays the patient's core temperature, usually measured via an esophageal or bladder probe, or a rectal or axillary thermometer. |
Other parameters: May include end-tidal CO2 (from the ventilator or a nasal cannula), central venous pressure (CVP), pulmonary artery pressure (PAP), and intracranial pressure (ICP). |
Central Monitoring Station: |
This is a separate workstation, usually located at the central nursing station, that displays the vital signs and waveforms of all patients in the ICU. This allows a single nurse to monitor multiple patients simultaneously, and it allows the charge nurse to have a bird's-eye view of the unit. |
Ventilator Integration: |
Modern ventilators are connected to the monitoring system. The system captures ventilator settings (FiO2, PEEP, tidal volume, rate, etc.) and displays them alongside the patient's vital signs. It also captures the patient's respiratory mechanics (compliance, resistance) and trends. |
Infusion Pump Integration: |
Smart infusion pumps are connected to the monitoring system. The system captures the infusion rates and the total volume of medications and fluids administered. It also has a drug library that provides dose limits and alerts for potential errors. |
Hemodynamic Monitoring (Advanced): |
Some ICU patients require advanced hemodynamic monitoring, such as: |
Pulmonary artery catheter (PAC or Swan-Ganz catheter): Measures pulmonary artery pressure, pulmonary capillary wedge pressure, cardiac output, and mixed venous oxygen saturation. |
Continuous cardiac output (CCO): A non-invasive or minimally invasive method of measuring cardiac output continuously. |
Transpulmonary thermodilution (e.g., PiCCO): A less invasive method that measures cardiac output and other hemodynamic parameters. |
These advanced monitors are integrated into the ICU monitoring system, providing a comprehensive picture of the patient's hemodynamic status. |
Continuous EEG (cEEG): |
For patients with seizures or suspected brain injury, continuous EEG monitoring is used. The ICU monitoring system captures the EEG signals and displays them alongside the vital signs. It can also provide automated seizure detection. |
Renal Replacement Therapy (Dialysis) Integration: |
If the patient is on continuous renal replacement therapy (CRRT), the dialysis machine is integrated into the monitoring system, capturing the patient's fluid balance and solute clearance. |
Electronic Flowsheet: |
The flowsheet is the digital equivalent of the paper chart. It is a structured grid that captures all patient data: vital signs, intake and output, ventilator settings, infusion rates, lab results, and clinical assessments. The flowsheet is automatically populated with data from the bedside monitor, the ventilator, and the infusion pumps. The nurse adds additional data (e.g., assessment findings, interventions). The flowsheet is the central repository of patient data, and it is integrated with the EHR. |
Clinical Decision Support (CDS) and Early Warning Scores (EWS): |
The ICU monitoring system uses CDS algorithms to analyze the data and generate alerts. |
Early Warning Scores (EWS): These are composite scores that combine multiple vital signs to predict the risk of clinical deterioration. The most common in the U.S. is the Modified Early Warning Score (MEWS) or the National Early Warning Score (NEWS). When the score exceeds a threshold, the system generates an alert. |
Sepsis Screening: The system monitors for signs of sepsis (e.g., fever, tachycardia, elevated lactate) and generates an alert. |
Arrhythmia Detection: The EKG analysis software detects arrhythmias (e.g., ventricular tachycardia, atrial fibrillation) and alerts the clinician. |
Hemodynamic Alerts: The system alerts for low blood pressure, high heart rate, or other hemodynamic abnormalities. |
Tele-ICU (Remote Monitoring): |
Many U.S. hospitals, especially smaller ones, use a Tele-ICU service. This is a remote monitoring service, typically provided by a central command center, where intensivists and critical care nurses monitor patients in multiple ICUs via video cameras, bedside monitor data, and the EHR. The Tele-ICU team can provide real-time consultation, review alarms, and recommend interventions. |
|
4. A Day in the Life of an ICU Nurse with the Monitoring System |
To understand how ICU monitoring works in practice, let us follow a nurse, John, on a typical 12-hour shift in a 12-bed medical ICU at a U.S. academic medical center. |
6:45 a.m. - Shift handoff: |
John receives report from the night nurse. He is assigned to two critically ill patients: Mrs. Jones, a 72-year-old with septic shock, and Mr. Smith, a 65-year-old with acute respiratory distress syndrome (ARDS). He reviews their flowsheets on the ICU monitoring system, noting their vital signs trends, their ventilator settings, and their infusion rates. |
7:00 a.m. - Rounds: |
John joins the ICU team (the intensivist, the fellow, the resident, the pharmacist, and the respiratory therapist) for rounds. They stand in front of the central monitoring station, which displays all 12 patients' vital signs. The team reviews each patient's status, using the flowsheet and the monitor data. |
8:00 a.m. - Bedside assessment: |
John performs a focused assessment on Mrs. Jones. He checks her vital signs on the bedside monitor, listens to her lungs, assesses her skin, and checks the status of her IV lines. He documents his findings in the electronic flowsheet. |
9:00 a.m. - Responding to an alarm: |
The central monitoring station sounds an alarm for Mr. Smith: his oxygen saturation has dropped to 85%. John rushes to the bedside. He checks the patient, suctions his endotracheal tube, and adjusts his oxygen settings. The SpO2 returns to 94%. The alarm stops. John documents the event in the flowsheet. |
10:00 a.m. - Medication administration: |
John administers a dose of IV antibiotics to Mrs. Jones. He scans her wristband barcode, scans the medication barcode, and administers the drug. The administration is documented in the MAR, which is integrated with the monitoring system. |
11:00 a.m. - Lab result review: |
A critical lab result appears in the flowsheet: Mrs. Jones's lactate level is 4.5 mmol/L (normal < 2.0), indicating worsening sepsis. John notifies the intensivist, who orders additional fluids and a reassessment of antibiotics. |
12:00 p.m. - Ventilator adjustment: |
The respiratory therapist adjusts Mr. Smith's ventilator settings. The ventilator's new settings are automatically captured by the monitoring system and displayed on the flowsheet. |
2:00 p.m. - Data review: |
John reviews Mrs. Jones's fluid balance (intake vs. output). The monitoring system has automatically calculated her intake (IV fluids) and output (urine, drainage) from the infusion pumps and the Foley catheter. He sees that she is in positive fluid balance, which may be contributing to her worsening respiratory status. He documents this in the flowsheet. |
4:00 p.m. - Tele-ICU consult: |
The Tele-ICU intensivist, located in a central command center 200 miles away, reviews Mrs. Jones's data and recommends a specific antibiotic change. John communicates this to the on-site intensivist. |
6:45 p.m. - Shift handoff: |
John prepares a handoff report for the oncoming night nurse. He uses the ICU monitoring system's handoff tool to create a summary: 'Mrs. Jones, septic shock, improving on antibiotics. Mr. Smith, ARDS, stable on ventilator.' He reviews the day's data and adds his notes. |
|
5. The Data Deluge: Managing the Torrent of Information |
The ICU generates an enormous amount of data. A single patient in the ICU can generate thousands of data points per hour. The monitoring system must collect, store, and display this data without overwhelming the clinicians. |
The challenge of data overload: |
Alarms: The monitoring system generates many alarms---for heart rate, blood pressure, SpO2, and many other parameters. The average U.S. ICU bed generates over 100 alarms per day. |
Waveforms: The EKG waveform, the arterial pressure waveform, the SpO2 waveform, and the respiratory waveform are displayed continuously. |
Trends: The flowsheet displays trends for vital signs, ventilator settings, and infusion rates. |
Clinical data: Lab results, imaging reports, and medication orders are also integrated into the monitoring system. |
The risk of alarm fatigue: The high volume of alarms leads to 'alarm fatigue.' Clinicians become desensitized to alarms, and they may ignore or delay responding to them. This can be dangerous, as a true critical alarm might be missed. |
U.S. regulatory focus: The U.S. Food and Drug Administration (FDA) and The Joint Commission have issued guidelines on alarm management. U.S. hospitals are required to have policies to reduce alarm fatigue, including: |
Default settings: Setting alarm thresholds to evidence-based ranges. |
Individualized alarms: Adjusting alarm thresholds for individual patients (e.g., a patient with a high baseline heart rate may need a higher threshold). |
Alarm suppression: Silencing certain alarms during specific periods (e.g., during bathing or when the patient is stable). |
Secondary notification: If an alarm is not acknowledged, it is escalated to another clinician. |
The role of AI: AI can help reduce alarm fatigue by: |
Predicting alarms: AI can predict which alarms are likely to be true and which are likely to be false, prioritizing the former. |
Suppressing false alarms: AI can learn to recognize patterns that are associated with false alarms and suppress them. |
Providing context: AI can provide context for an alarm---e.g., 'This SpO2 alarm is likely due to a patient turning, not a true desaturation.' |
|
6. The Electronic Flowsheet: The Central Repository |
The electronic flowsheet is the central repository of patient data in the ICU. It is a structured, time-based grid that captures all relevant data. |
What is captured: |
Vital signs: Blood pressure, heart rate, respiratory rate, temperature, SpO2, and others. |
Intake and output: Oral intake, IV fluids, blood products, urine output, drainage, and estimated blood loss. |
Ventilator settings: FiO2, PEEP, tidal volume, rate, pressure support, etc. |
Infusion pumps: Rates and total volumes for all medications and fluids. |
Lab results: All lab results, with trended data. |
Clinical assessments: The nurse's assessment findings (e.g., lung sounds, skin assessment). |
Medications: Scheduled and PRN medications administered. |
Tasks: A record of completed tasks (e.g., turning, positioning, wound care). |
How it is used: |
Trend analysis: Clinicians use the flowsheet to visualize trends. For example, they can see if a patient's blood pressure is trending down, or if their urine output is decreasing. |
Fluid balance: The flowsheet automatically calculates the patient's fluid balance (intake minus output). |
Decision support: The CDS system uses the flowsheet data to generate alerts (e.g., for sepsis or deterioration). |
Handoff: The flowsheet is used to generate a summary for shift handoffs. |
Integration with the EHR: The flowsheet is fully integrated with the EHR. Data from the flowsheet populates the patient's chart, and data from the EHR (e.g., lab results, medications) populates the flowsheet. |
|
7. The Ventilator Integration: Breathing for the Patient |
Mechanical ventilation is one of the most common interventions in the ICU. The ventilator is a complex machine that must be carefully set and monitored. The ICU monitoring system integrates the ventilator data. |
Ventilator settings: |
FiO2: The fraction of inspired oxygen (from 21% to 100%). |
Tidal volume: The volume of gas delivered per breath (measured in mL). |
Respiratory rate: The number of breaths per minute (set by the clinician or determined by the patient). |
PEEP: Positive end-expiratory pressure, which keeps the lungs open. |
Pressure support: The pressure used to assist the patient's spontaneous breaths. |
Inspiratory pressure: The maximum pressure during inspiration. |
I:E ratio: The inspiratory-to-expiratory time ratio. |
Ventilator monitoring: |
Peak inspiratory pressure: The maximum pressure during inspiration. |
Plateau pressure: The pressure measured after a breath when there is no flow. |
Compliance: The change in volume per unit of pressure (a measure of lung stiffness). |
Resistance: The resistance to airflow. |
The ICU monitoring system displays these settings and measurements, and it tracks trends. It can also generate alerts for high peak pressures, low compliance, or other abnormalities. |
|
8. The Smart Infusion Pump: Safety and Documentation |
Smart infusion pumps are a critical component of ICU care. They are used to deliver a wide range of IV medications and fluids, from antibiotics and vasopressors to sedatives and narcotics. |
Drug library: The pump has a drug library that contains a list of all the medications that can be programmed into the pump, along with their default concentrations, dosing limits, and administration guidelines. |
Dose error reduction: If the clinician attempts to program a dose that is outside the acceptable range, the pump generates an alert and may block the dose. |
Integration: The smart pump is integrated with the monitoring system. The system captures the pump's settings (infusion rate, volume) and displays them on the flowsheet. The system also records when the infusion is started, paused, or stopped. |
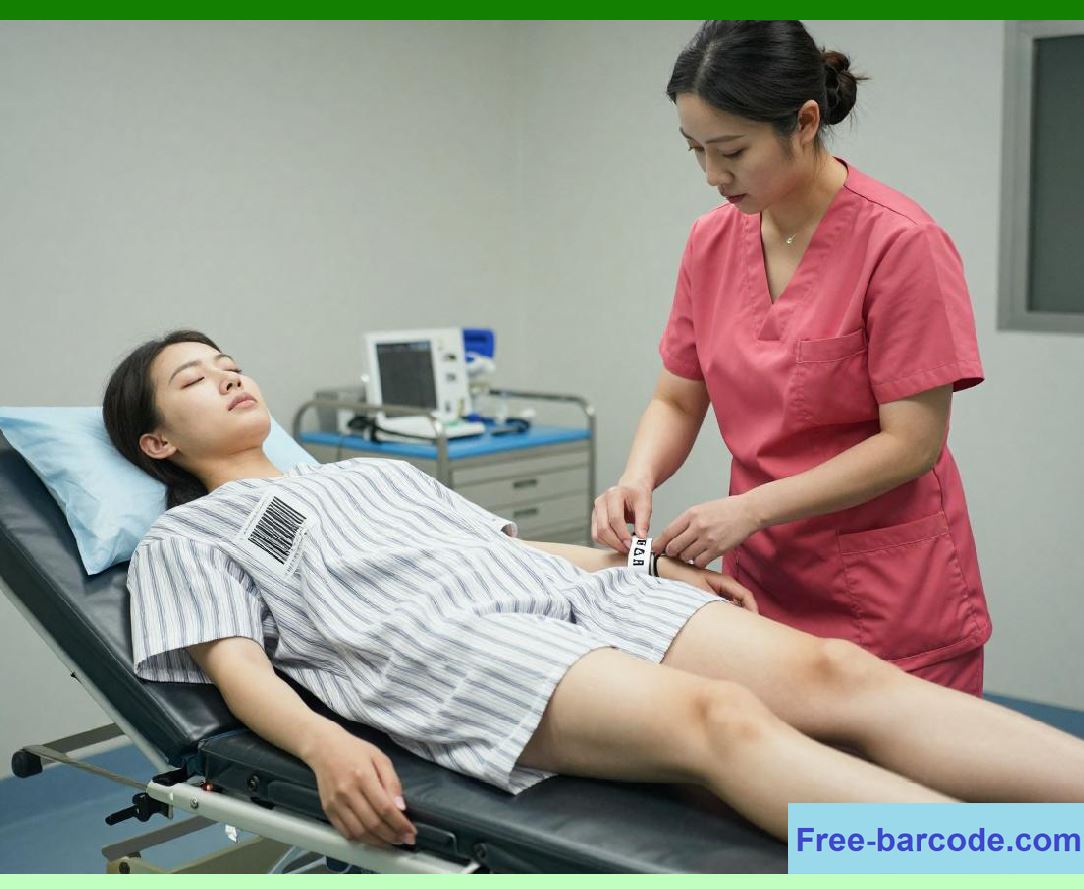
Barcode scanning: The clinician scans the patient's wristband barcode and the medication barcode before programming the pump, ensuring the Five Rights. |

|
9. Hemodynamic Monitoring: The Art of Managing the Failing Heart |
For patients with severe cardiovascular instability, advanced hemodynamic monitoring is essential. The ICU monitoring system integrates these advanced monitors. |
Pulmonary artery catheter (PAC or Swan-Ganz catheter): |
This is a catheter that is inserted into the pulmonary artery. It measures: |
Central venous pressure (CVP): The pressure in the right atrium, which reflects right heart function and venous return. |
Pulmonary artery pressure (PAP): The pressure in the pulmonary artery. |
Pulmonary capillary wedge pressure (PCWP): The pressure in the left atrium, which reflects left heart function and fluid status. |
Cardiac output (CO): The volume of blood pumped by the heart per minute. |
Mixed venous oxygen saturation (SvO2): The oxygen saturation of the blood returning to the heart, which reflects the balance between oxygen delivery and oxygen consumption. |
PiCCO (Pulse contour cardiac output): |
This is a minimally invasive monitor that uses a thermodilution technique. It measures: |
Cardiac output: The volume of blood pumped by the heart per minute. |
Global end-diastolic volume (GEDV): A measure of preload (the filling of the heart). |
Extravascular lung water (EVLW): A measure of pulmonary edema (fluid in the lungs). |
The ICU monitoring system displays these hemodynamic parameters and trends them over time. It can also calculate derived parameters, such as systemic vascular resistance (SVR). |

|
10. Continuous EEG (cEEG): Monitoring the Brain |
Continuous EEG (cEEG) is used for patients with seizures, traumatic brain injury, stroke, or other neurological conditions. The ICU monitoring system captures the EEG signals and displays them. |
Seizure detection: The system can automatically detect seizures, alerting the clinician. |
Sedation monitoring: cEEG can also be used to monitor the level of sedation in patients who are receiving paralytics. |
Prognosis: cEEG can provide prognostic information in patients with cardiac arrest or severe brain injury. |

|
11. U.S. Case Study: A Quaternary ICU at a Major Academic Medical Center |
A quaternary ICU at a major U.S. academic medical center, such as Massachusetts General Hospital or Johns Hopkins, is a showcase of the most advanced ICU monitoring technology. |
Scale: The ICU has 30 beds, including a dedicated neuroscience ICU, a cardiac ICU, and a medical ICU. |
Integration: The ICU monitoring system is fully integrated with the Epic EHR. Data from all devices (bedside monitors, ventilators, infusion pumps, dialysis machines, EEG machines) flows seamlessly into the EHR. |
Analytics: The ICU uses a sophisticated early warning score (EWS) that combines vital signs, lab results, and clinical assessments. The EWS is updated every 15 minutes and generates alerts when the score exceeds a threshold. |
Tele-ICU: The hospital uses a Tele-ICU service to provide nighttime coverage and to manage surges in patient volume. |
Research: The ICU's data is also used for research. The hospital has a data warehouse that contains millions of ICU data points, which are used to develop and validate new CDS algorithms. |
Outcomes: The ICU's mortality rates are among the lowest in the nation, and its median length of stay is below the national average. |

|
12. U.S. Case Study: A Community Hospital ICU |
A 250-bed community hospital in the Midwest has a 12-bed mixed medical-surgical ICU. |
Scale: The ICU is staffed by hospitalists and pulmonologists, with intensivist coverage during the day and Tele-ICU coverage at night. |
Integration: The ICU uses a Cerner EHR with integrated monitoring. The system is less extensive than a quaternary ICU, but it covers all the essential functions. |
Challenges: The ICU faces challenges with alarm fatigue---there are many false alarms, and the nurses are often overwhelmed. |
Solutions: The hospital implemented an alarm management program, adjusting the default alarm thresholds and individualizing them for each patient. They also implemented a secondary notification system, so if an alarm is not acknowledged, it goes to the charge nurse or the physician. |
Outcomes: The alarm management program reduced the number of alarms by 30% and improved nurse satisfaction. |
|
13. U.S. Case Study: A Rural Critical Access Hospital ICU with Tele-ICU |
A rural Critical Access Hospital in Nebraska has a 4-bed ICU. The hospital has no on-site intensivist. |
Tele-ICU: The ICU uses a Tele-ICU service, provided by a university medical center in a nearby state. The Tele-ICU intensivist and nurses monitor the patients remotely, using video cameras and the ICU monitoring system. |
Integration: The ICU monitoring system is integrated with the hospital's EHR and the Tele-ICU platform. The Tele-ICU team can see the patient's vital signs, ventilator settings, and infusion rates in real time. |
Impact: The Tele-ICU service has improved the quality of care, reduced mortality, and reduced the need for patient transfers to larger hospitals. |
|
14. The ICU and the 'Sepsis' Mandate |
Sepsis is a leading cause of death in U.S. hospitals, and the ICU is the front line. The ICU monitoring system is essential for sepsis detection and treatment. |
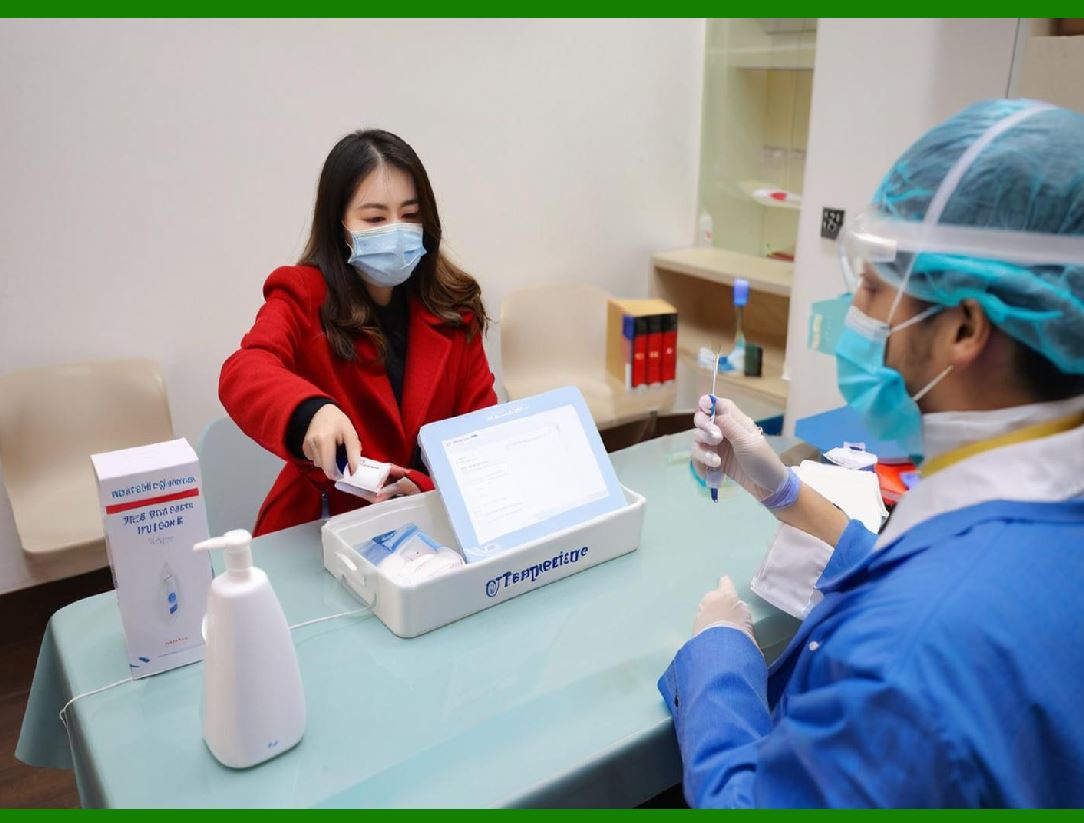
Sepsis screening: The monitoring system continuously screens for signs of sepsis---fever, tachycardia, tachypnea, elevated lactate, altered mental status. When the criteria are met, an alert is triggered. |
The sepsis bundle: The system supports the Sepsis Bundle (a set of evidence-based interventions), including: |
Blood cultures: Before antibiotics. |
Lactate level: To assess tissue perfusion. |
Antibiotics: Within 1 hour. |
Fluids: A 30 mL/kg fluid bolus. |
Vasopressors: To maintain blood pressure. |
Reassessment: Continuous monitoring of lactate and hemodynamics. |
Tracking: The system tracks the time to each element of the bundle, providing a continuous quality improvement tool. |
|
15. The ICU and the 'Early Warning Score' (EWS) |
Early Warning Scores (EWS) are a key component of ICU monitoring. They are composite scores that combine multiple vital signs. |
Common EWS systems: The most common in the U.S. is the Modified Early Warning Score (MEWS) or the National Early Warning Score (NEWS). |
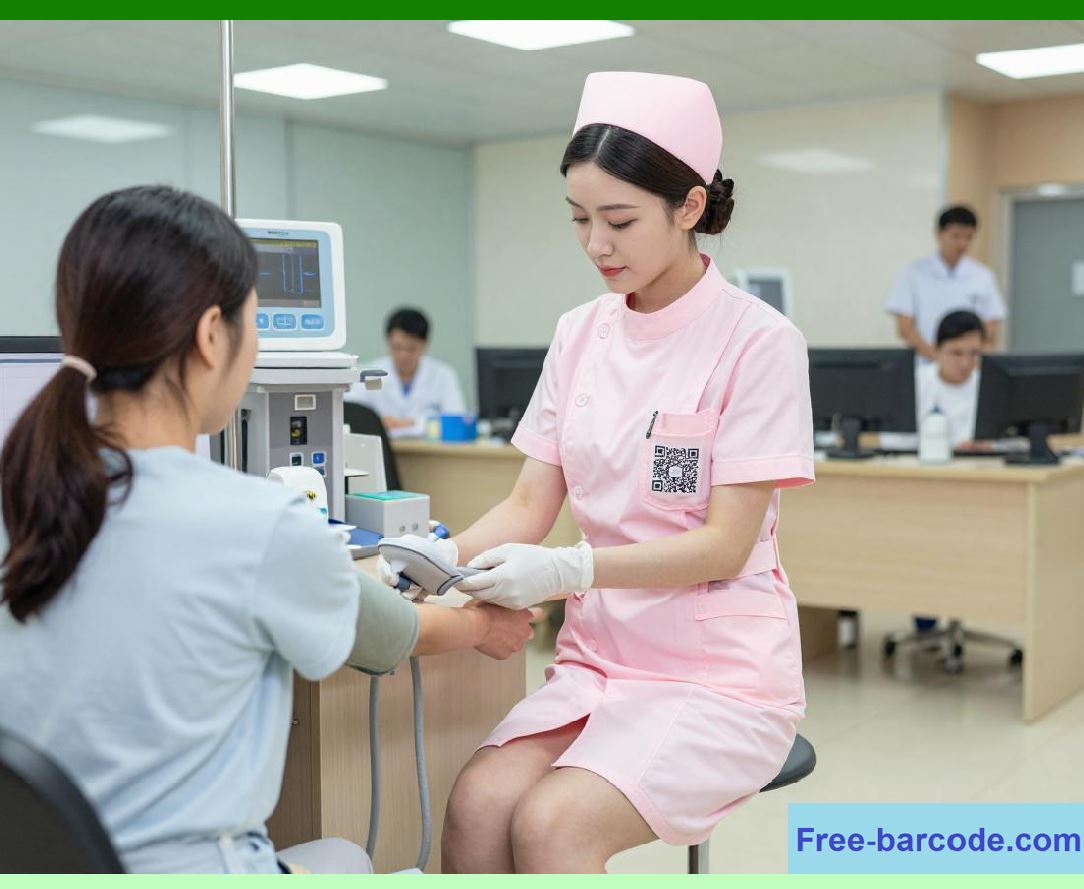
How it works: Each vital sign (e.g., heart rate, blood pressure, respiratory rate, temperature, SpO2, and AVPU---Alert, Voice, Pain, Unresponsive) is scored from 0 to 3 (or more). The scores are added together to create a total score. A higher score indicates a higher risk of deterioration. |
The response: If the score exceeds a certain threshold (e.g., 5), the system generates an alert, and a 'Rapid Response Team' (RRT) is activated. The RRT is a team of experienced clinicians (often an intensivist, a critical care nurse, and a respiratory therapist) who respond to the bedside. |
|
16. The ICU and the 'Rapid Response Team' (RRT) |
The Rapid Response Team (RRT) is a system for early intervention in deteriorating patients. The RRT is activated when the EWS score exceeds a threshold, or when a clinician has a 'gut feeling' that a patient is deteriorating. |
The RRT process: |
1. The EWS alert is triggered. |
2. The system notifies the RRT (via pager, phone, or secure message). |
3. The RRT team assembles at the patient's bedside. |
4. The RRT team assesses the patient, recommends interventions, and coordinates care. |
5. If the patient is stable, they may be transferred to the ICU. If not, they remain on the floor with closer monitoring. |
The RRT and the ICU: The RRT is a critical link between the general wards and the ICU. It prevents many patients from deteriorating to the point where they need ICU admission, or it ensures they are admitted early. |

|
17. Alarm Fatigue: A Persistent Challenge |
Alarm fatigue is one of the most persistent and serious challenges in the ICU. It is a national patient safety priority in the U.S. |
The problem: The ICU generates thousands of alarms per day---for heart rate, blood pressure, SpO2, ventilator pressures, and many other parameters. Many of these alarms are false or non-actionable. Clinicians become desensitized, and they may ignore or delay responding to alarms. |
The consequences: Alarm fatigue has been linked to patient deaths. A patient may suffer a cardiac arrest, and the alarm is ignored because it is perceived as a false alarm. |
U.S. regulatory action: The FDA and The Joint Commission have issued alerts on alarm fatigue. U.S. hospitals are required to have policies and procedures for alarm management. |
Strategies to reduce alarm fatigue: |
Individualized alarms: Setting alarm thresholds for each patient based on their baseline and clinical condition. |
Default settings: Setting defaults that are based on evidence and clinical guidelines. |
Alert suppression: Suppressing certain alarms during periods of low risk (e.g., during sleep). |
Secondary notification: Escalating alarms to a secondary clinician if they are not acknowledged. |
Technology: Using AI to predict and prioritize alarms, reducing false alarms. |
Education: Training clinicians on alarm management and the importance of timely response. |
|
18. The ICU and the EHR: A Unified View |
The ICU monitoring system is fully integrated with the EHR. This provides a unified view of the patient's data. |
Benefits: |
No manual charting: Data flows automatically from the monitors to the EHR, reducing manual data entry and errors. |
Real-time access: Any clinician can access the patient's data from any location. |
Trend analysis: The EHR provides a longitudinal view of the patient's data. |
Decision support: The CDS system, integrated with the EHR, provides alerts and recommendations. |
Research: The data can be used for research and quality improvement. |
|
19. The Future of ICU Monitoring: AI, Predictive Analytics, and Continuous Vigilance |
The ICU monitoring system is evolving rapidly, driven by AI and the goal of continuous vigilance. |
AI-powered prediction: AI can predict patient deterioration hours in advance, allowing for early intervention. For example, an AI model might predict a patient's risk of developing acute kidney injury (AKI) based on a combination of vital signs, lab results, and clinical data, hours before the AKI becomes clinically apparent. |
Automated documentation: Ambient intelligence will allow clinicians to document the ICU encounter with zero clicks, using a microphone that captures the clinician-patient conversation and generates a structured note. |
Smart alarms: AI will prioritize alarms, reducing false alarms and ensuring that critical alarms are never missed. |
Digital twins: A digital twin is a virtual representation of the patient, created from the monitoring data. The clinician can use the digital twin to test different treatment strategies before applying them to the patient. |
Integration with wearables: In the future, continuous monitoring may extend beyond the ICU, with patients wearing sensors that transmit data to the hospital. |
|
Detailed Concluding Summary |
This chapter has provided a comprehensive, plain-English exploration of Intensive Care Unit (ICU) Monitoring---the most data-intensive and life-critical module within the Hospital Information System. We began by framing the ICU as the high-stakes arena where the sickest patients receive continuous vigilance, supported by a cascade of monitors, ventilators, and pumps. We traced the evolution of ICU monitoring from simple waveform displays to today's integrated, predictive platforms. |
We detailed the core components: the bedside monitor with its multiple waveforms and parameters; the central monitoring station for bird's-eye surveillance; ventilator integration that captures settings and mechanics; smart infusion pump integration for safety and documentation; advanced hemodynamic monitoring (PAC, PiCCO); continuous EEG for brain monitoring; the electronic flowsheet as the central repository; clinical decision support and early warning scores; and Tele-ICU for remote monitoring. We followed a nurse, John, through a typical shift, showing how the monitoring system is used at every step---from shift handoff and rounds to bedside assessment, alarm response, medication administration, and data review. |
We explored the challenge of data overload and alarm fatigue, describing the volume of alarms and the risk of desensitization, and we detailed U.S. regulatory and hospital strategies to address it, including individualized alarms, default settings, secondary notification, and AI-powered prioritization. We examined the electronic flowsheet as the central repository, and we delved into the integration of ventilators, smart infusion pumps, and advanced hemodynamic monitors. |
We presented three U.S. case studies: a quaternary ICU at a major academic medical center with its sophisticated integration, analytics, and Tele-ICU; a community hospital ICU that reduced alarm fatigue and improved nurse satisfaction through an alarm management program; and a rural Critical Access Hospital ICU that used Tele-ICU to provide intensivist coverage and improve outcomes. |
We discussed the ICU's role in the sepsis mandate, with continuous screening, the sepsis bundle, and time-based tracking. We explored the Early Warning Score (EWS) and the Rapid Response Team (RRT) as key components of patient safety. We revisited alarm fatigue as a persistent challenge, with its consequences and strategies for mitigation. |
We emphasized the integration of ICU monitoring with the EHR, providing a unified view of the patient's data and enabling real-time access and trend analysis. Finally, we looked to the future of ICU monitoring: AI-powered prediction of deterioration, automated documentation, smart alarms, digital twins for treatment simulation, and integration with wearables for continuous monitoring beyond the ICU. |

|
In conclusion, ICU monitoring is not merely about watching numbers on a screen. It is about creating a continuous, vigilant presence that gives clinicians the power to anticipate, prevent, and respond to life-threatening events before they become irreversible. It is the digital nervous system that turns the ICU from a place of reactive crisis management into a place of proactive, data-driven critical care. In a U.S. healthcare system where ICUs account for a disproportionate share of hospital costs and mortality, ICU monitoring is the essential infrastructure for keeping the sickest patients alive---and for giving them the best possible chance of recovery. |
 cs@easiersoft.com