Part 7: Reporting, Analytics, Audit Trails, and Operational Monitoring |
1. Introduction to Reporting and Analytics in Label Printing Modules |
While backend logic ensures proper label generation and printing, reporting and analytics provide visibility into operations. In an ERP-integrated barcode label printing system, reporting serves multiple purposes: |
1. Track operational efficiency |
2. Identify printing errors and failures |
3. Monitor resource utilization |
4. Support compliance and auditing |
5. Inform strategic decisions |
Proper reporting and analytics help managers optimize workflows, reduce costs, and maintain regulatory compliance. |

|
2. Core Reporting Components |
2.1 Print Job Reports |
Include: |
1. Job ID |
2. Template used |
3. User who initiated the print |
4. Printer used |
5. Number of labels generated |
6. Status (completed, failed, pending) |
7. Timestamps |
2.2 Printer Performance Reports |
1. Average print speed per printer |
2. Downtime statistics |
3. Error rates |
4. Consumables usage (e.g., labels, ribbons, ink) |
2.3 User Activity Reports |
1. Who created or modified templates |
2. Frequency of label generation by user |
3. User-specific printing errors |
2.4 Compliance Reports |
1. Regulatory label printing adherence |
2. Audit trail of modifications |
3. Batch and lot tracking |
4. Expiration date checks |

|
3. Analytics for Operational Insights |
Analytics allows for pattern recognition and decision support. |
3.1 Volume Analysis |
* Track labels printed per day/week/month |
* Identify peak periods for workload balancing |
3.2 Error Trend Analysis |
* Identify recurring printer failures or misprints |
* Detect template errors causing data mismatch |
3.3 Resource Utilization |
* Track label stock consumption |
* Monitor ink/ribbon usage |
* Predict replenishment needs |
3.4 Efficiency Metrics |
* Average time from ERP transaction to printed label |
* Job completion time distribution |
* Throughput per printer |

|
4. Audit Trails |
Audit trails are essential for regulatory compliance, internal controls, and operational accountability. |
4.1 Purpose of Audit Trails |
1. Track changes to templates and business rules |
2. Record user activities in printing |
3. Maintain historical logs for compliance |
4.2 Audit Trail Elements |
1. User ID |
2. Action performed (create, edit, delete, print) |
3. Timestamp |
4. Affected entity (template, job, printer) |
5. Original and new values (for edits) |
4.3 Security and Integrity |
1. Immutable storage or append-only logs |
2. Digital signatures for critical operations |
3. Encryption to protect sensitive data |

|
5. Operational Monitoring Dashboard |
A live monitoring dashboard provides real-time operational visibility. |
5.1 Dashboard Components |
1. Printer status (online/offline, errors) |
2. Queue lengths |
3. Job progress |
4. Label consumption |
5.2 Alerts and Notifications |
* Trigger notifications for: |
1. Printer offline |
2. Job failure |
3. Low label stock |
5.3 KPI Display |
* Key metrics include: |
1. Labels printed per hour |
2. Print success rate |
3. Average job completion time |

|
6. Reporting Architecture |
6.1 Data Sources |
* ERP database |
* Label printing module logs |
* Printer management system |
6.2 ETL Process (Extract, Transform, Load) |
1. Extract: Gather data from various sources |
2. Transform: Normalize, aggregate, and filter data |
3. Load: Populate reporting database or data warehouse |
6.3 Reporting Tools |
1. Built-in ERP reporting engine |
2. Third-party BI tools (e.g., Power BI, Tableau) |
3. Custom web dashboards |

|
7. Report Types |
7.1 Operational Reports |
* Provide daily or weekly summaries for managers |
7.2 Analytical Reports |
* Detailed charts and trends for decision-making |
7.3 Compliance Reports |
* Printable PDFs for regulatory submissions |
7.4 Ad-Hoc Reports |
* Allow users to filter by date, printer, template, or user |

|
8. Real-Time vs Historical Reporting |
8.1 Real-Time Reporting |
* Display current print job progress |
* Highlight printer issues instantly |
8.2 Historical Reporting |
* Store past job data for analysis |
* Generate trends over weeks, months, or years |
9. Integration with ERP Analytics |
* Connect print module metrics with broader ERP KPIs |
* Example: Label volume vs inventory turnover |
* Example: Printing errors correlated with shipping delays |

|
10. Data Visualization |
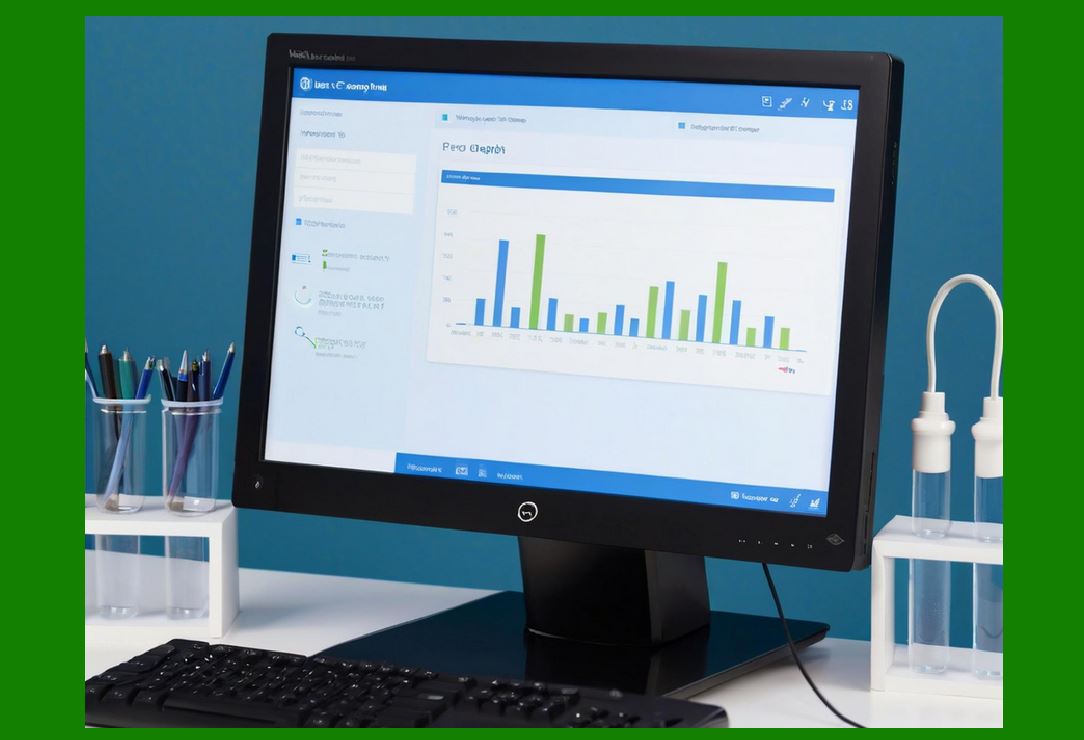
10.1 Charts and Graphs |
* Line charts for trends |
* Bar charts for comparative data |
* Pie charts for proportion of errors |
10.2 Heat Maps |
* Show high-volume printers or frequent error locations |
10.3 Drill-Down Capabilities |
* Clickable charts to see job-level or template-level details |
11. Monitoring High-Volume Printing Environments |
11.1 Load Distribution |
* Identify overloaded printers |
* Rebalance print jobs automatically |
11.2 Bottleneck Detection |
* Highlight slow printers or frequent job retries |
* Provide corrective actions |

|
12. Automated Alerts |
12.1 Alert Channels |
1. Email |
2. SMS |
3. ERP notification center |
12.2 Trigger Conditions |
1. Printer offline > 5 minutes |
2. Print job fails repeatedly |
3. Template approval pending |
13. KPI Examples for Label Printing Module |
1. Print success rate (%) |
2. Average labels per print job |
3. Mean time to printer recovery (MTTPR) |
4. Template utilization rate |
5. Error rate per user or printer |

|
14. Compliance and Regulatory Reporting |
14.1 Regulatory Requirements |
* Food & Drug Administration (FDA) |
* GS1 compliance for barcodes |
* ISO standards for traceability |
14.2 Automated Compliance Checks |
* Validate batch numbers and expiration dates |
* Ensure mandatory warning labels are included |
15. Historical Job Analysis |
* Identify trends in: |
1. High-error templates |
2. Frequent printer issues |
3. User activity patterns |
* Use for proactive improvements |

|
16. Printer Consumables Analytics |
1. Track label stock consumption per printer |
2. Monitor ribbon/ink usage |
3. Predict replenishment needs using historical trends |
17. Data Retention Policies |
* Define how long to keep: |
1. Job logs |
2. Audit trails |
3. Analytical data |
* Balance storage cost vs compliance requirements |
18. Security Considerations for Reporting |
1. Limit access to sensitive reports |
2. Role-based dashboards |
3. Encrypt exported reports (PDF, Excel) |
|
19. Export and Sharing Options |
* PDF, Excel, CSV |
* Email or ERP internal messaging |
* Scheduled report generation |
20. Advanced Analytics with Machine Learning |
20.1 Predictive Maintenance |
* Predict printer failures based on historical errors |
20.2 Workflow Optimization |
* Suggest optimal batch sizes or printer allocation |
20.3 Anomaly Detection |
* Detect abnormal job patterns or data inconsistencies |
|
21. User-Friendly Interface for Analytics |
1. Dashboard customization |
2. Filtering and sorting options |
3. Drill-down into individual job details |
4. Interactive charts |
22. Summary of Part 7 |
In Part 7, we covered: |
1. Reporting and analytics for label printing |
2. Print job, printer performance, and user activity reports |
3. Audit trails and compliance reporting |
4. Operational monitoring dashboards |
5. KPI tracking, alerts, and resource utilization |
6. Historical analysis and predictive analytics |
7. Integration with ERP and data visualization |

|
Next Section |
In Part 8, we will explore: |
* Security and data protection in barcode printing modules |
* Encryption of sensitive ERP and label data |
* Role-based access and permissions |
* Network and printer security considerations |
* Compliance with regulatory frameworks |
 cs@easiersoft.com