AzureLabel: Comprehensive Analysis |
Part 9: Reporting, Analytics, and Audit Functions in AzureLabel |
110. Introduction to Reporting and Analytics |
Reporting and analytics are core components of AzureLabel, providing visibility into label production, usage patterns, and operational efficiency. By combining data from built-in tables, smart serial numbers, print jobs, and templates, the software enables organizations to generate actionable insights. These capabilities support decision-making, regulatory compliance, and continuous process improvement. |

|
111. Print Job Reports |
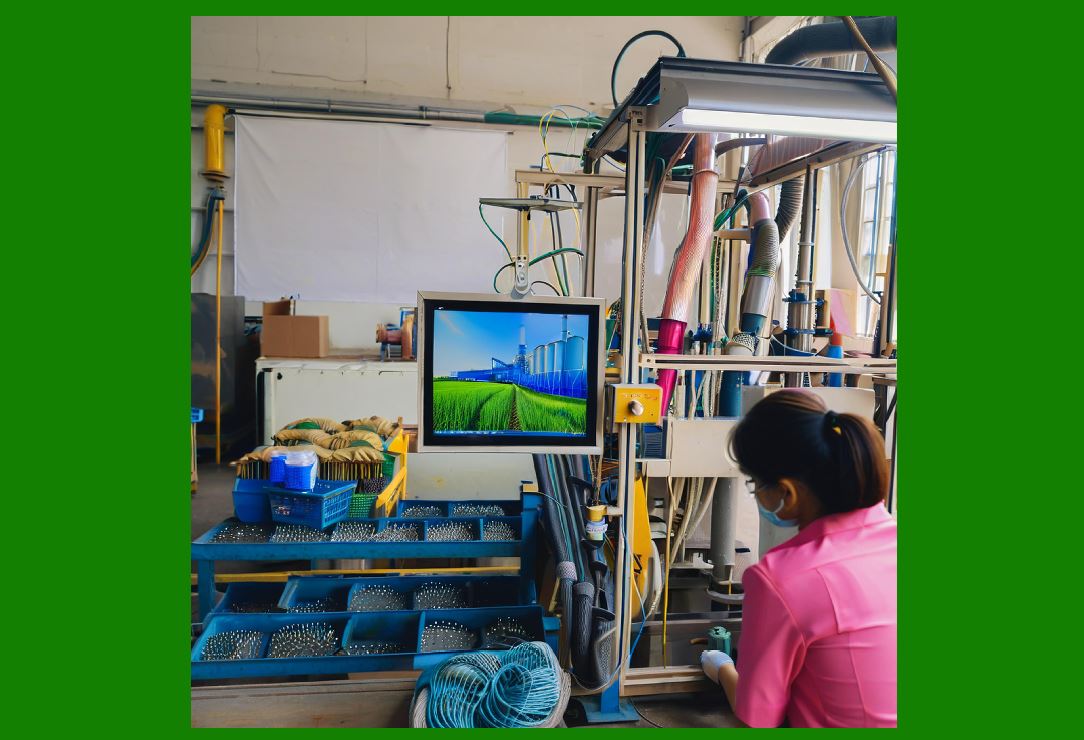
AzureLabel automatically logs details for every print job, including job name, label template used, number of labels printed, serial number ranges, user ID, timestamp, and printer details. Users can generate reports to track production volumes, identify bottlenecks, and verify that all jobs were completed successfully. This reporting helps managers monitor workload distribution and plan resources effectively. |
|
112. Label Usage Statistics |
The software provides detailed statistics on label usage. Users can analyze how many labels were printed per product line, per batch, or over a specified time period. These statistics assist in inventory planning, material ordering, and production scheduling. Historical trends can also be evaluated to forecast future labeling needs and optimize resource allocation. |

|
113. Data Table Utilization Reports |
AzureLabel tracks how built-in data tables are used across labels. Reports show which records were printed, which fields were populated dynamically, and how often specific data sets were utilized. This information is valuable for auditing data accuracy, monitoring compliance, and detecting anomalies, such as duplicate or missing entries. |

|
114. Serial Number Tracking |
Smart serial numbers are essential for traceability, anti-counterfeiting, and quality control. AzureLabel provides detailed tracking of all generated serial numbers, including ranges used, associated label templates, and corresponding production batches. This allows companies to quickly verify the integrity of serialized products and respond efficiently in case of recalls or investigations. |

|
115. Barcode and QR Code Analytics |
The software monitors barcode and QR code usage, capturing information such as symbology type, data encoded, and print frequency. These analytics are crucial for evaluating scanning success rates, compliance with industry standards, and identifying potential labeling issues that could impact operational efficiency or regulatory adherence. |

|
116. Audit Trail Reports |
AzureLabel maintains comprehensive audit trails of user activity, template modifications, and data table updates. Administrators can generate audit reports detailing who performed specific actions, what changes were made, and when they occurred. These reports are critical for compliance with regulatory requirements such as FDA 21 CFR Part 11, ISO standards, and internal quality policies. |

|
117. Exception and Error Reporting |
AzureLabel tracks errors and exceptions during label printing or data processing. Reports highlight issues such as missing data, duplicate serial numbers, printer malfunctions, or template inconsistencies. By providing actionable insights, the software allows operators and managers to correct problems proactively, reducing waste and avoiding compliance violations. |

|
118. Multi-Dimensional Analysis |
AzureLabel supports multi-dimensional reporting, allowing users to combine variables for deeper insights. For example, a report could show label print volumes per product line across different warehouses over time. This type of analysis helps organizations optimize production, allocate resources efficiently, and improve overall operational performance. |

|
119. Scheduled Reporting |
Reports in AzureLabel can be scheduled for automatic generation and distribution. Managers can receive daily, weekly, or monthly summaries of label printing activities, data table usage, and compliance metrics. Scheduled reporting ensures consistent monitoring without requiring manual intervention, saving time and improving accountability. |
|
120. Visual Analytics and Dashboards |
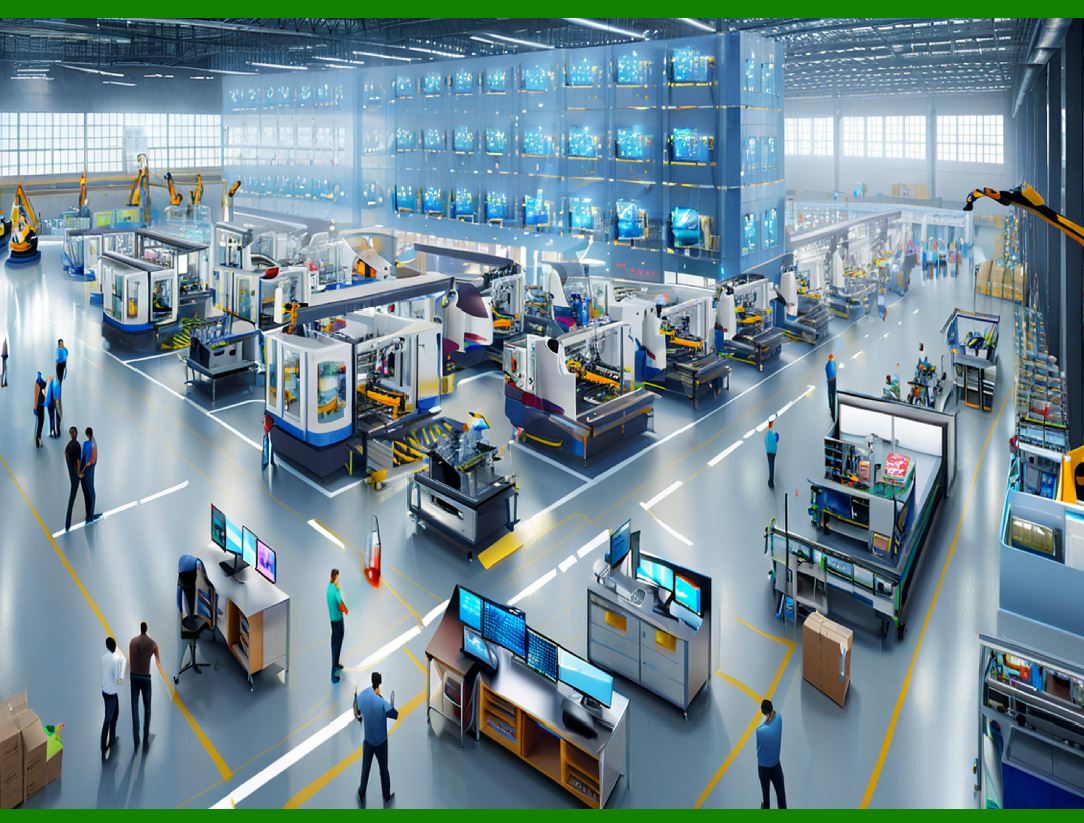
AzureLabel includes visual analytics tools and dashboards to present key metrics graphically. Charts, graphs, and heatmaps display trends in label usage, serial number assignments, and print job volumes. Visualizations make it easier to identify anomalies, patterns, and areas for improvement, supporting data-driven decision-making. |

|
121. Integration with Enterprise Reporting Systems |
AzureLabel can export reports in multiple formats, including PDF, Excel, and CSV, enabling integration with enterprise reporting systems or business intelligence platforms. This allows organizations to consolidate labeling data with other operational metrics, providing a holistic view of production efficiency, inventory management, and compliance performance. |

|
122. Compliance and Regulatory Reporting |
Regulated industries require detailed documentation of labeling activities. AzureLabel supports compliance reporting by capturing data for each printed label, serial number, and template change. Reports can be formatted to meet industry-specific regulatory standards, ensuring that all labeling operations are auditable and verifiable during inspections or audits. |

|
123. Summary of Part 9 |
In summary, AzureLabel reporting, analytics, and audit functions provide comprehensive visibility into labeling operations. Print job reports, label usage statistics, serial number tracking, error reports, and visual dashboards enable organizations to monitor performance, optimize workflows, and ensure compliance. Integration with enterprise reporting systems and scheduled reporting further enhances operational oversight, supporting efficiency, traceability, and regulatory adherence. |
 cs@easiersoft.com