Print Barcode Label Using MS Office 365 |
Part 17: Enterprise Deployment Strategies, High-Availability Systems, and Global Barcode Infrastructure Design in Office 365 |
1. Introduction to Enterprise Deployment at Scale |
1.1 From System Design to Global Deployment |
In earlier parts, we built: |
1. Barcode generation logic (Excel, VBA, APIs) |
2. Database structures (Access / cloud) |
3. Automation workflows (Power Automate) |
4. Label printing systems (Word + printers) |
5. Enterprise architecture models |
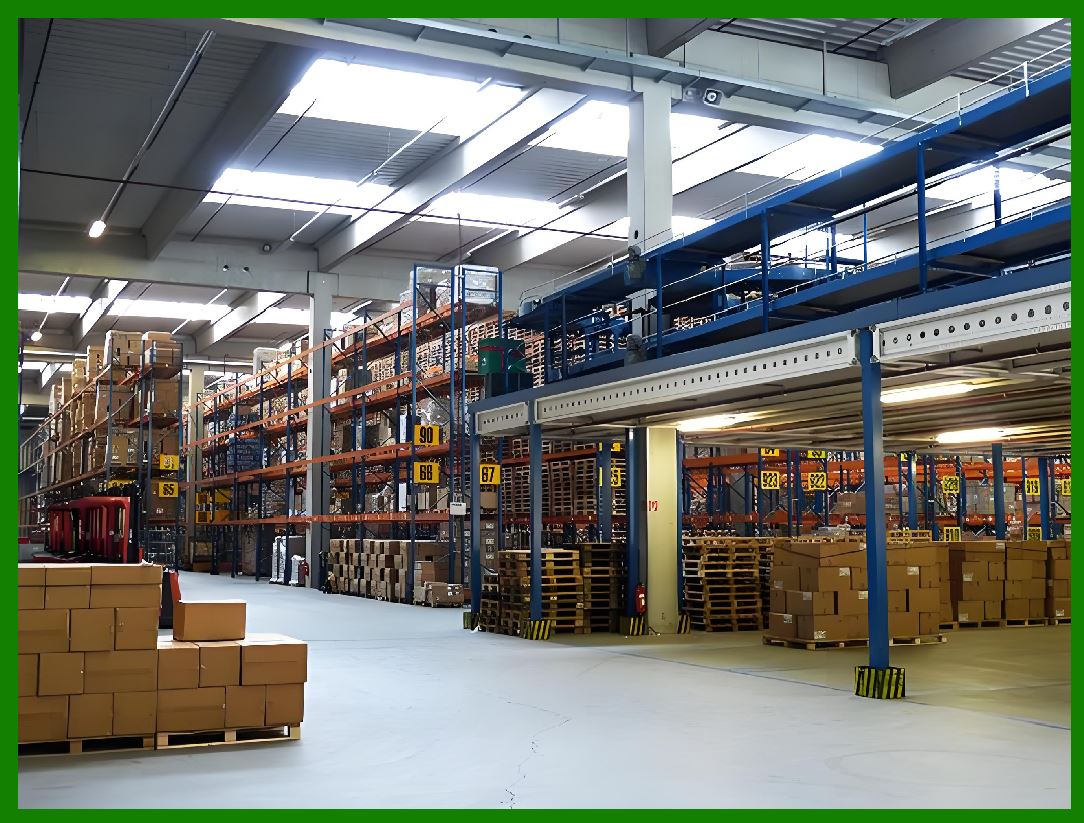
Now the focus shifts to the final stage: deploying barcode systems across multiple departments, locations, and even global operations. |
At this level, the system is no longer just a tool, it becomes critical infrastructure supporting supply chains, logistics, retail operations, and compliance systems. |
|
2. Principles of Enterprise-Grade Deployment |
2.1 Reliability First |
Enterprise barcode systems must ensure: |
1. Continuous operation |
2. Zero data loss tolerance |
3. Minimal downtime |
4. Predictable performance |
2.2 Consistency Across Locations |
A global barcode system must guarantee: |
1. Same barcode standards everywhere |
2. Identical label formats |
3. Synchronized data rules |
2.3 Centralized Control with Distributed Execution |
Best practice architecture: |
1. Central data governance |
2. Distributed printing nodes |
3. Cloud-based coordination |

|
3. High-Availability System Design |
3.1 What is High Availability (HA) |
High availability means the system remains operational even if: |
1. A server fails |
2. A printer goes offline |
3. A network connection drops |
3.2 Office 365 HA Model |
Office 365 supports HA through: |
1. Cloud redundancy (Microsoft datacenters) |
2. OneDrive/SharePoint replication |
3. Multi-region data storage |
3.3 Redundant System Components |
To achieve HA in barcode systems: |
1. Duplicate databases (primary + backup) |
2. Multiple print servers |
3. Redundant automation workflows |

|
4. Multi-Site Barcode System Deployment |
4.1 Warehouse Distribution Model |
Example structure: |
1. Central headquarters system |
2. Regional warehouse nodes |
3. Local printing stations |
4.2 Data Synchronization Strategy |
Options include: |
1. Real-time sync via SharePoint |
2. Scheduled batch updates |
3. Hybrid sync model |
4.3 Conflict Resolution Mechanisms |
When multiple sites update data: |
1. Timestamp-based resolution |
2. Master-data priority rules |
3. Version control enforcement |

|
5. Global Barcode Standardization Strategy |
5.1 Importance of Standardization |
Without standards: |
1. Barcodes may not scan globally |
2. Supply chain mismatches occur |
3. Compliance failures increase |
5.2 Common Standards |
Enterprise systems typically align with: |
1. GS1 standards |
2. ISO barcode specifications |
3. Industry-specific encoding rules |
5.3 Office 365 Implementation |
Standardization enforced through: |
1. Excel templates |
2. Access validation rules |
3. Power Automate logic constraints |

|
6. Centralized Data Governance Model |
6.1 Master Data Management (MDM) |
MDM ensures: |
1. Single source of truth |
2. Consistent product identifiers |
3. Controlled updates |
6.2 Role of Access / Cloud Databases |
They serve as: |
1. Central barcode authority |
2. Validation checkpoint |
3. Audit repository |
6.3 Data Lifecycle Control |
Stages: |
1. Creation |
2. Validation |
3. Distribution |
4. Archival |

|
7. Distributed Printing Architecture |
7.1 Local Printing Nodes |
Each location may have: |
1. Local printer |
2. Lightweight Excel/Word interface |
3. Cloud-connected data access |
7.2 Print Queue Distribution |
Benefits: |
1. Reduced network load |
2. Faster local printing |
3. Fault isolation |
7.3 Failover Printing System |
If one printer fails: |
1. Jobs reroute to backup printers |
2. System logs error automatically |
3. No interruption to workflow |

|
8. Network Architecture for Barcode Systems |
8.1 Cloud-Centric Design |
Core components: |
1. SharePoint (data hub) |
2. Power Automate (workflow engine) |
3. Excel Online (processing layer) |
8.2 Hybrid Architecture |
Combines: |
1. Local Office installations |
2. Cloud services |
3. On-premise databases |
8.3 Offline Resilience |
Even without internet: |
1. Local Excel processing continues |
2. Print jobs queue locally |
3. Sync resumes when reconnected |

|
9. Security in Enterprise Deployment |
9.1 Multi-Layer Security Model |
1. Identity layer (user authentication) |
2. Data layer (encryption) |
3. Application layer (Office permissions) |
4. Network layer (secure transmission) |
9.2 Identity and Access Management |
Includes: |
1. Role-based access control |
2. Multi-factor authentication |
3. Conditional access policies |
9.3 Secure Barcode Data Flow |
Ensure: |
1. No unauthorized modification |
2. Encrypted cloud storage |
3. Controlled print access |

|
10. Monitoring and System Observability |
10.1 Key Monitoring Metrics |
1. Barcode generation success rate |
2. Print job completion rate |
3. System response time |
4. Error frequency |
10.2 Centralized Logging System |
Logs track: |
1. Data changes |
2. Automation execution |
3. Printing history |
10.3 Alerting Mechanisms |
Trigger alerts for: |
1. Print failures |
2. Data inconsistencies |
3. Workflow breakdowns |

|
11. Disaster Recovery Strategy |
11.1 Types of Failures |
1. Server failure |
2. Data corruption |
3. Printer network outage |
4. Cloud service disruption |
11.2 Recovery Mechanisms |
1. Backup restoration |
2. Failover systems |
3. Data rollback via version history |
11.3 Recovery Time Objectives (RTO) |
Enterprise systems aim for: |
1. Minimal downtime |
2. Fast restoration of printing services |

|
12. Scaling to Global Operations |
12.1 Multi-Region Deployment |
Barcode systems can span: |
1. North America |
2. Europe |
3. Asia-Pacific |
12.2 Regional Data Optimization |
Each region may have: |
1. Local data cache |
2. Regional printing servers |
3. Local compliance rules |
12.3 Cross-Region Synchronization |
Managed through: |
1. Cloud replication |
2. Scheduled synchronization |
3. Event-based updates |

|
13. Performance Engineering at Scale |
13.1 System Bottleneck Analysis |
Common bottlenecks: |
1. Excel processing limits |
2. Network latency |
3. Print queue congestion |
13.2 Optimization Techniques |
1. Batch processing of labels |
2. Parallel workflow execution |
3. Reduced API calls |
13.3 Load Distribution Strategy |
Distribute workload across: |
1. Multiple Excel instances |
2. Multiple printers |
3. Multiple automation flows |

|
14. Cost Optimization in Enterprise Deployment |
14.1 Infrastructure Cost Control |
1. Use cloud-native services instead of custom servers |
2. Optimize license usage in Microsoft 365 |
3. Reduce unnecessary automation runs |
14.2 Printing Cost Optimization |
1. Minimize reprints |
2. Optimize label layout density |
3. Use cost-efficient printers |
14.3 Operational Efficiency |
Reduce labor costs by: |
1. Automating repetitive tasks |
2. Eliminating manual label creation |
3. Centralizing control systems |

|
15. Future-Proof Architecture Design |
15.1 Cloud-First Evolution |
Future barcode systems will rely on: |
1. Serverless computing |
2. API-driven barcode generation |
3. AI-based workflow optimization |
15.2 Integration with IoT |
Barcode systems will connect to: |
1. Smart warehouses |
2. Automated inventory tracking |
3. Real-time logistics sensors |
15.3 AI-Enhanced Optimization |
AI may: |
1. Predict label demand |
2. Optimize printing schedules |
3. Detect barcode errors automatically |

|
16. Summary of Part 17 |
In this section, we covered: |
1. Enterprise deployment strategies |
2. High-availability system design |
3. Global barcode infrastructure |
4. Multi-site synchronization |
5. Security and compliance at scale |
6. Disaster recovery planning |
7. Performance and cost optimization |
This represents the transition from system design to real-world global deployment of Office 365 barcode labeling systems. |
 cs@easiersoft.com