The data statistical analysis function of Excel can handle general-volume data and is an entry-level application. Excel is the tool software we use most every day, and its functions are far more powerful than we imagine. |
To go deeper, you can use spss, python and other tools. These have special requirements for data analysis. For example, you need to discover the key points of growth behind the data and provide driving force for business growth. |
Statistics is a science about collecting, organizing, summarizing, describing and analyzing data using scientific methods, and making inferences and decisions based on this. Statistics in a narrow sense are used to refer to data or some numbers obtained from data. |
|
It can be seen from the definition of statistics that the key to statistics lies in the analysis and processing of data, and the powerful data analysis functions of Excel are exactly suitable for the problems that statistics must deal with. Therefore, Excel has been widely used in statistics since its creation. , and various macros specially developed for statistical analysis make Excel a practical and efficient tool in statistical analysis. Although professional statistical software such as SPSS and SAS have more powerful statistical analysis functions in some aspects, they either require professional programming or require high prices, so their popularity is far less than Excel. |
The following introduces the typical applications of Excel in statistics. |
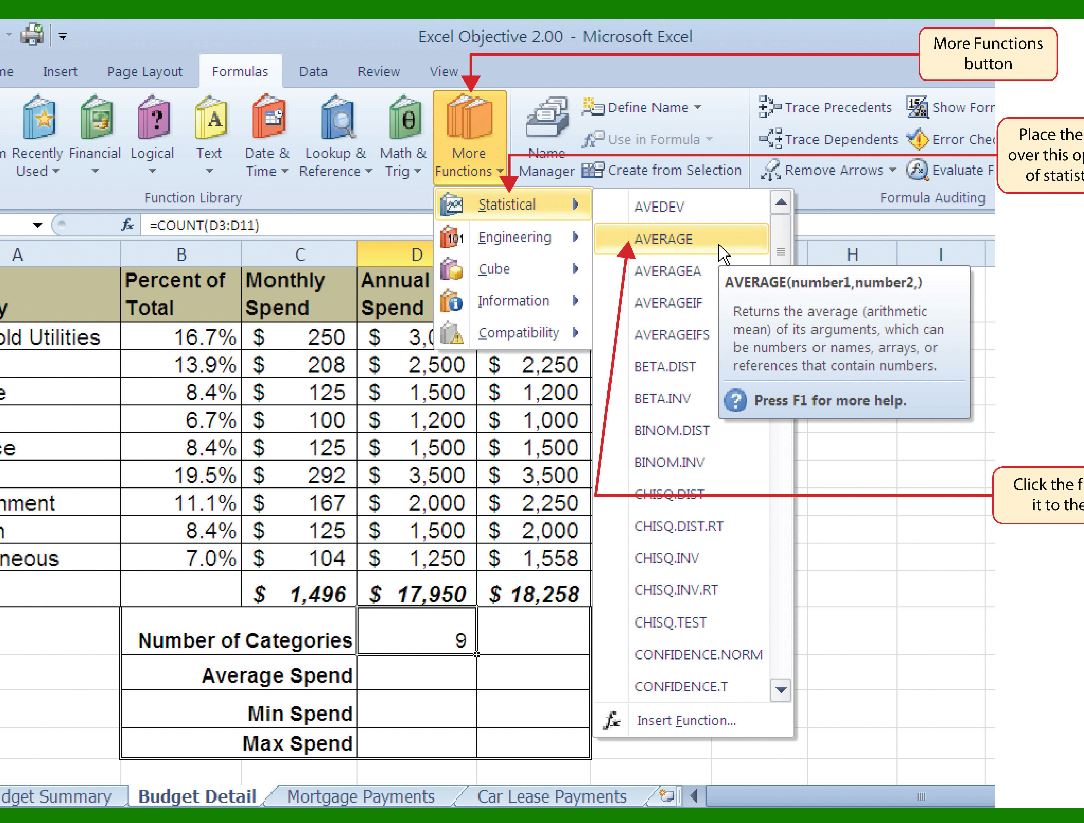
As a spreadsheet software, Excel's core data structure is cells and cell ranges. Therefore, Excel, like database software, manages and processes a batch of regular data. Based on the row and column structure of Excel, data is processed in the worksheet according to standard database specifications. This is also called Excel's internal database technology. By creating Excel's internal database, statistical analysis of data can be achieved through database functions. |
|
1) Database statistical functions |
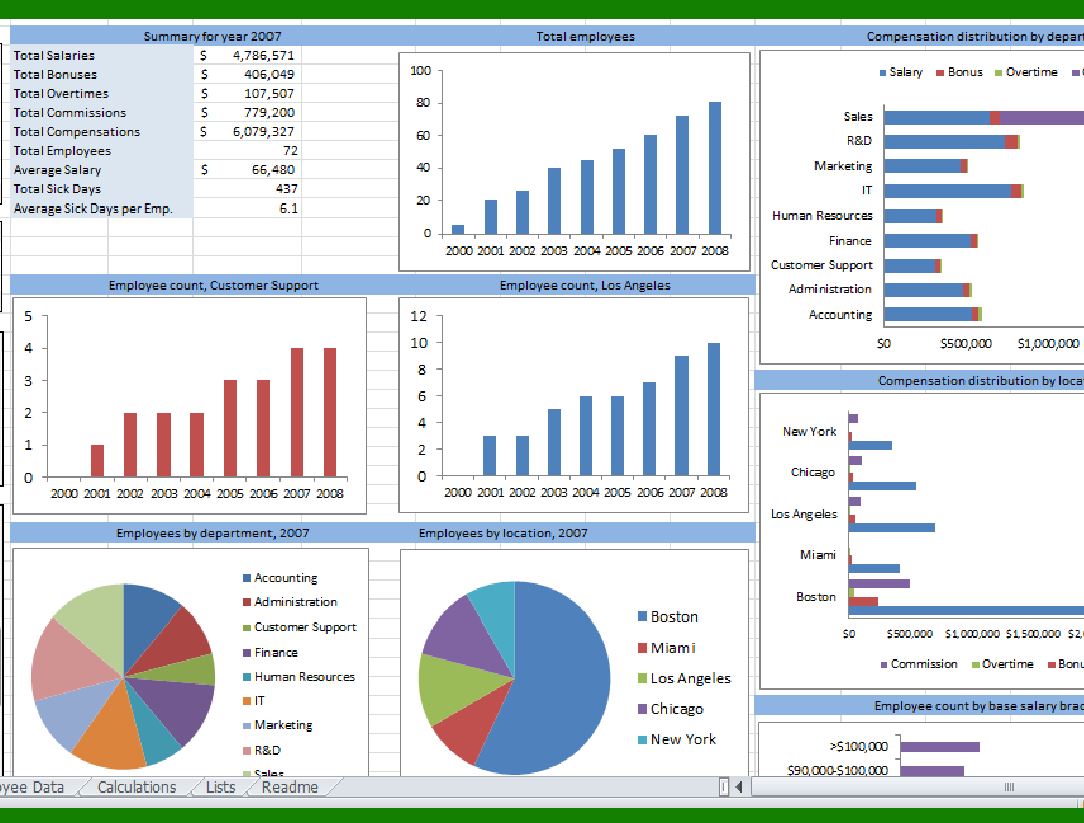
On the basis of establishing an internal database, Excel specifically includes a set of worksheet functions that perform statistical operations on data stored in a data list or database. These functions are collectively called database functions or Dfunctions. Each function generally corresponds to three parameters: database, field and criteria. These parameters correspond to the worksheet area used by the function. These functions can be used to perform some basic statistical operations in daily statistical work. |
Dfunctions have the same syntax format: Dfunctions (database, field, criteria). Among them: Dfunctions is the name of the database function. There are a total of 12 database functions in Exeel; |
|
Database is a cell range that constitutes a data list and database. A database is a list containing a set of related data, which contains behavioral records of related information, and the columns containing the data are fields. The first row of the list contains the flag item of each column, which is the data column or field used by the function. The data column in the data list should be located in the first row and have a flag item; |
Field can be text, that is, a flag item with quotes on both ends, such as "category", "manufacturer", or it can be the position of the data column in the data list, such as "1" means the first column, and "2" means the second List. field can also be omitted. If omitted, the function will return all values in the data list that meet the conditions; |
Criteria is a set of cell ranges that contain given conditions. You can specify any range for the criteria parameter, as long as it contains at least one column flag and a cell below the column flag for setting the criteria. |
|
2) Pivot table |
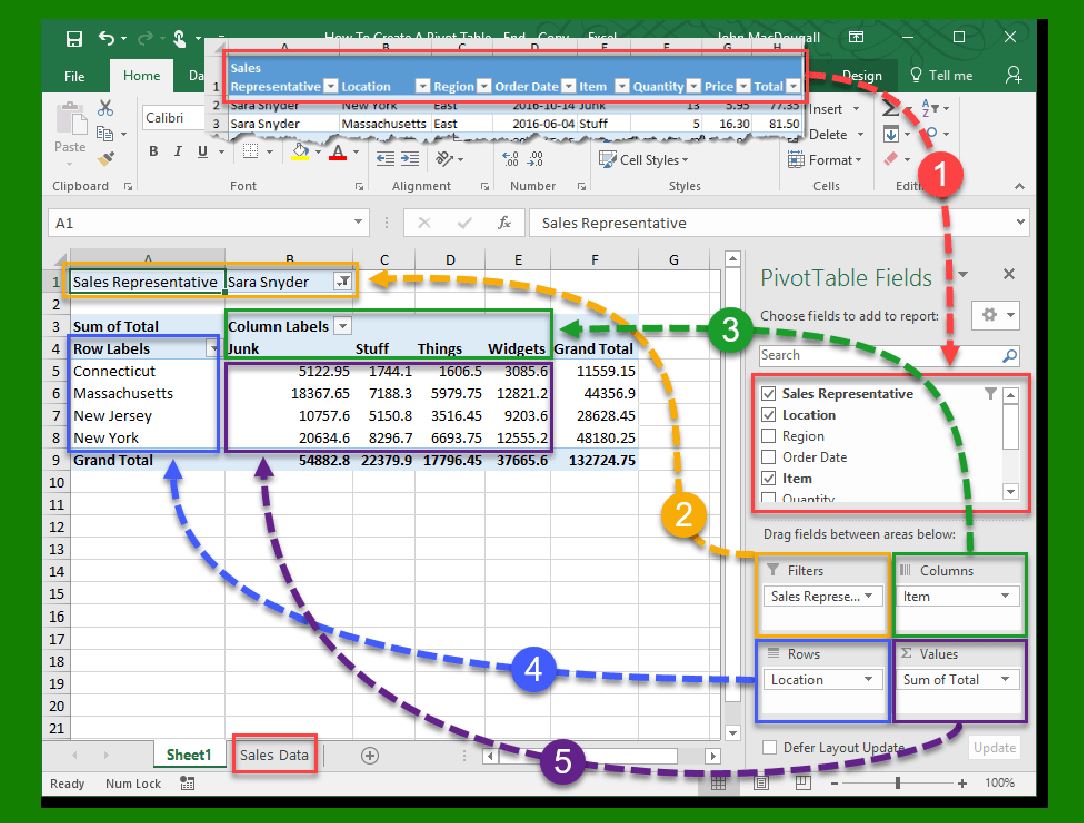
Pivot tables are an important feature in Excel, and they are even more important for statistics. Since the Excel worksheet can only provide a binary data structure composed of rows and columns, when you need to reflect multi-dimensional issues in statistics, you need to use the pivot table function. |
The "pivot" of the silkworm pivot table is It can express three-dimensional concepts in a limited two-digit data plane, and the pivot table combined with the data pivot chart function makes it possible to quickly form statistical charts with specific requirements, and the display effect of the chart can be changed at any time according to the requirements, realizing Effective statistical analysis and statistical plotting. |
|
3) Statistical index |
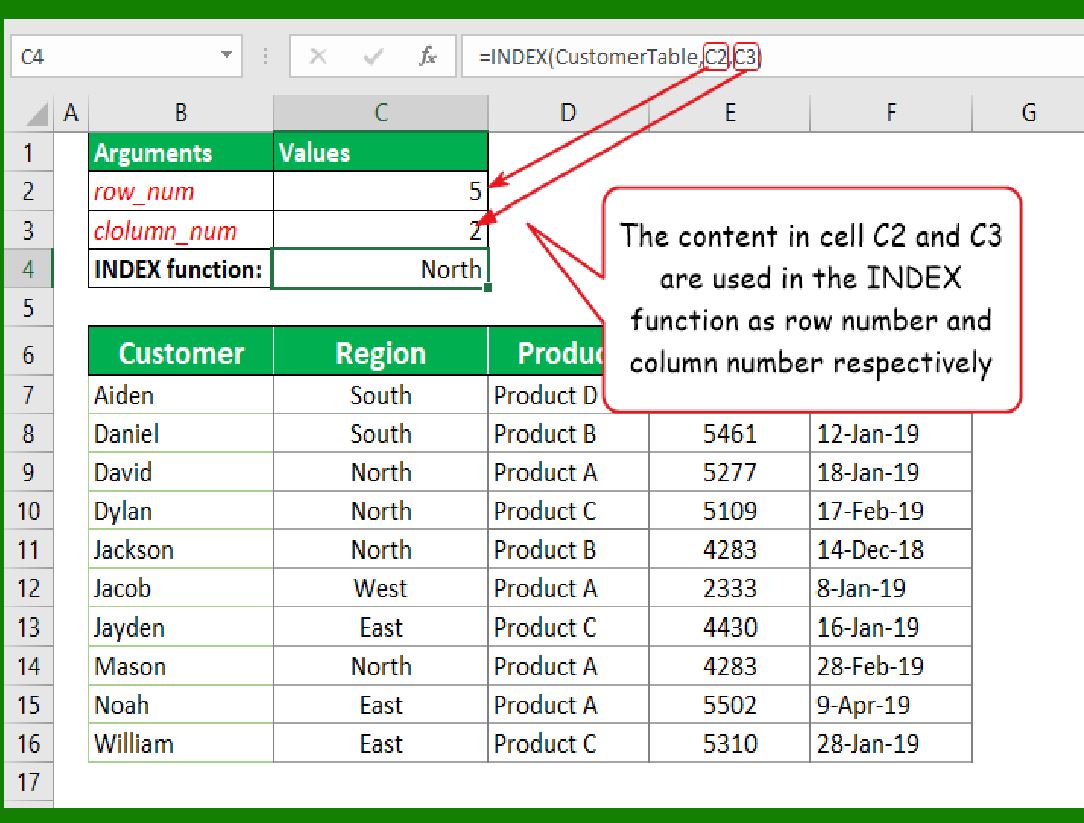
In statistics, an index is a single descriptive statistic that summarizes the relative changes in an underlying variable or set of variables. For example, the stock price index can reflect the overall changes in the stock market, and the consumer price index (CPI) can reflect the overall changes in the prices of residents' main consumption materials. |
|
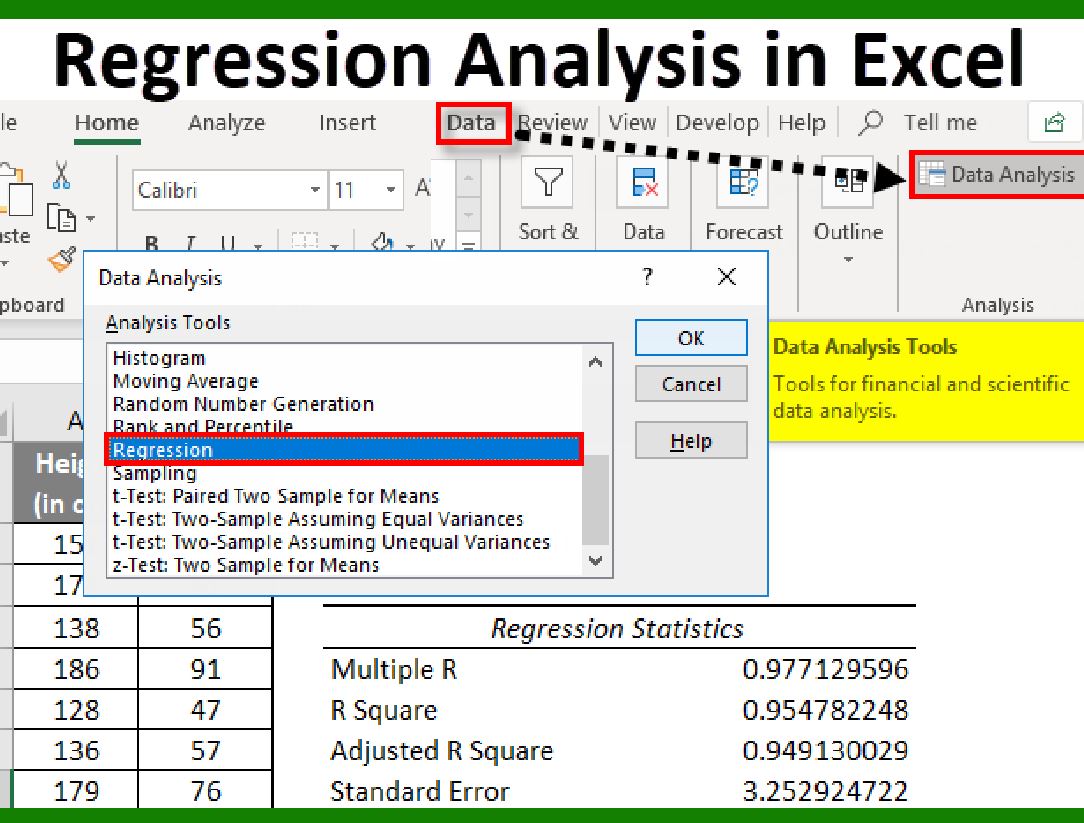
Execl has many applications in statistics, such as probability distribution diagrams, sampling distributions, parameter estimation, hypothesis testing, regression analysis and prediction, and time series analysis. Its powerful statistical functions can meet the needs of economics, medicine, meteorology, agriculture, etc. Data analysis in various fields such as Excel provides reliable reference for people's analysis and decision-making. With the continuous upgrading of Excel version, its functions are becoming increasingly perfect, and it has broad application prospects. |
 cs@easiersoft.com