Deeper Dive into the Five-Layer IoT Architecture |
1. Introduction to the Five-Layer IoT Architecture |
1.1 The Internet of Things (IoT) represents one of the most transformative technological paradigms of the 21st century. At its core, IoT connects physical objects—ranging from household appliances to industrial machines—to digital networks, enabling them to collect, exchange, and process data autonomously or semi-autonomously. |
1.2 The complexity of IoT systems demands a structured way to describe and design their functioning. Early conceptualizations of IoT often employed a three-layer architecture: the perception layer, the network layer, and the application layer. While effective in illustrating the general flow of IoT data, the three-layer model often fell short when applied to real-world deployments involving millions of devices, real-time analytics, edge computing, and massive-scale data storage. |
1.3 To address this limitation, researchers, engineers, and industry practitioners proposed a five-layer IoT architecture. This architecture provides a more nuanced view of how IoT systems function, incorporating new aspects such as edge computing and data management layers that have become indispensable in modern deployments. |
1.4 The five-layer IoT architecture includes: |
Perception Layer: Responsible for sensing and collecting information from the physical world. |
Network Layer: Ensures that collected data is reliably transmitted across communication channels. |
Edge Layer: Performs preprocessing and filtering of data closer to where it is generated. |
Data Layer: Manages, organizes, and stores massive datasets generated by IoT devices. |
Application Layer: Provides meaningful services, analytics, decision support, and user interfaces to end users. |
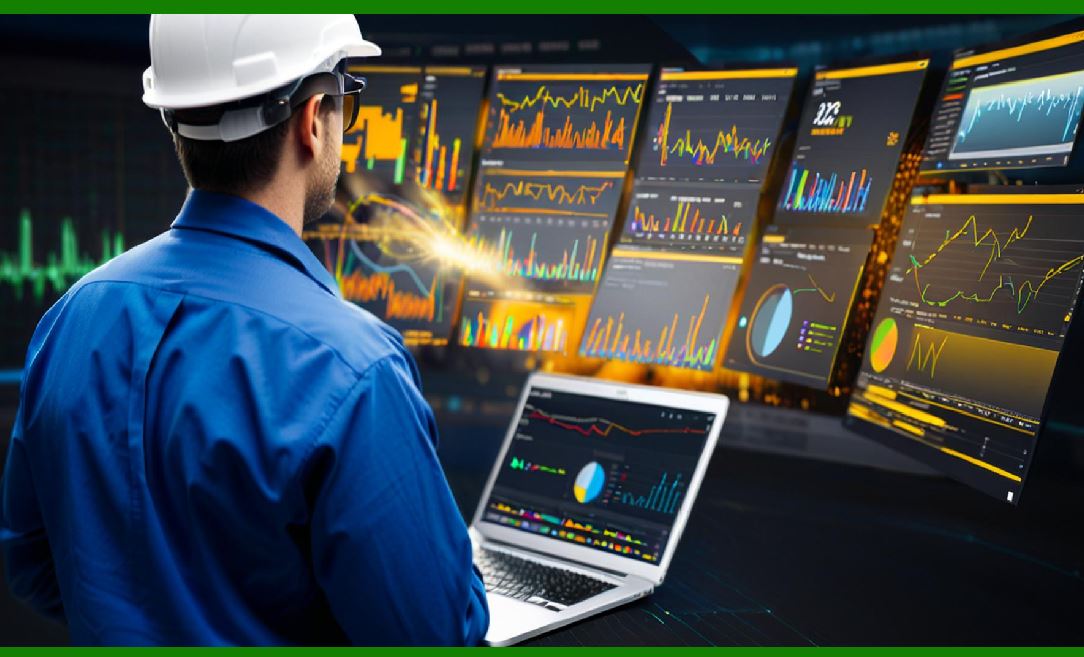
1.5 This layered framework not only simplifies the design of IoT systems but also ensures scalability, modularity, and adaptability. Each layer has specific responsibilities, yet they are interconnected in ways that make the entire IoT ecosystem function as a coherent whole. |
|
2. Historical Evolution of IoT Architectures |
2.1 Before diving into the specific layers, it is essential to understand how IoT architectures have evolved over time. Initially, IoT was seen as an extension of wireless sensor networks (WSNs). The architecture of WSNs emphasized sensors, gateways, and centralized servers. However, as IoT expanded into consumer electronics, healthcare, transportation, smart cities, and industrial automation, the limitations of such architectures became evident. |
2.2 The three-layer model was introduced to simplify the complexity by grouping functionality into three domains. It quickly gained traction as it was easy to explain: devices collect data, networks transport it, and applications use it. |
2.3 However, as IoT adoption scaled up, new challenges arose: |
Data Volume Explosion: Billions of devices generating terabytes and petabytes of data daily. |
Real-Time Processing Needs: Many IoT applications, such as autonomous driving or remote surgery, cannot tolerate the latency of sending all data to a cloud for processing. |
Heterogeneity: Devices vary widely in capabilities, from simple RFID tags to high-powered edge servers. |
Security and Privacy: Handling sensitive data requires dedicated layers of encryption, access control, and governance. |
2.4 These challenges demanded an expanded architectural model, leading to the development of the five-layer architecture. By adding an edge layer and a data layer, this model captures two critical realities of modern IoT: computation must happen closer to devices, and storage/management of massive datasets must be robust and scalable. |
|
3. Detailed Breakdown of the Five Layers |
3.1 Perception Layer |
3.1.1 The perception layer is where the physical world and the digital world intersect. This is the foundation of the IoT stack, responsible for sensing, measuring, and collecting data from the environment. |
3.1.2 Components in the perception layer include: |
Sensors: Temperature sensors, humidity sensors, pressure gauges, accelerometers, gyroscopes, cameras, microphones, and biosensors. |
RFID Tags and Readers: Enable automatic identification of objects. |
Actuators: Devices that convert digital signals into physical actions, such as motors, valves, and relays. |
Embedded Systems: Microcontrollers and small processors embedded in devices that facilitate initial data handling. |
3.1.3 The perception layer must ensure accuracy, reliability, and energy efficiency. In many cases, sensors are deployed in environments with limited power supply. Thus, low-energy communication protocols and efficient sampling strategies are critical. |
3.1.4 A key function of this layer is data digitization. Analog phenomena (sound, heat, movement) must be converted into digital signals that can be processed by subsequent layers. |
3.1.5 Challenges in the perception layer include: |
Sensor calibration and drift. |
Harsh environmental conditions (dust, heat, moisture). |
Data redundancy (multiple sensors capturing similar values). |
Security vulnerabilities such as physical tampering. |
3.2 Network Layer |
3.2.1 Once data is collected, it must be transmitted reliably to processing entities. The network layer provides this functionality, connecting perception devices to edge servers, data centers, or cloud platforms. |
3.2.2 The network layer encompasses a wide array of communication technologies: |
Short-range protocols: Bluetooth Low Energy, Zigbee, Z-Wave, Wi-Fi, NFC. |
Wide-area networks: Cellular (4G, 5G), LPWAN technologies such as LoRaWAN, NB-IoT, and Sigfox. |
Wired connections: Ethernet, fiber optics, industrial fieldbus systems. |
3.2.3 Responsibilities of the network layer include: |
Addressing and Identification: Ensuring that each device has a unique identity, often via IPv6. |
Routing: Determining the most efficient path for data transmission. |
Quality of Service (QoS): Guaranteeing performance levels for latency-sensitive applications. |
Security: Encrypting data in transit and preventing unauthorized interception. |
3.2.4 In addition, the network layer must support heterogeneity: integrating old and new devices, high-bandwidth and low-power nodes, stationary and mobile devices. |
3.3 Edge Layer |
3.3.1 The edge layer introduces a paradigm shift in IoT. Instead of sending all raw data to centralized clouds, the edge layer processes data closer to its source. This reduces latency, decreases bandwidth costs, and enables real-time decision-making. |
3.3.2 Components of the edge layer include: |
Edge Gateways: Devices that aggregate data from sensors and provide local processing. |
Micro Data Centers: Small-scale data centers located at the edge of the network. |
AI Accelerators: Chips designed to run machine learning inference close to devices. |
3.3.3 Key functions of the edge layer: |
Data Filtering and Preprocessing: Removing redundant or noisy data. |
Event Detection: Recognizing anomalies or important events locally. |
Real-Time Decision Making: For example, in autonomous vehicles or industrial control systems. |
Local Storage: Caching recent data before forwarding summaries to the data layer. |
3.3.4 Benefits of the edge layer: |
Reduced latency, often measured in milliseconds. |
Lowered cloud bandwidth costs. |
Improved security by keeping sensitive data local. |
3.4 Data Layer |
3.4.1 The data layer is dedicated to storage, organization, and management of the vast datasets generated by IoT systems. This layer provides the backbone for analytics, machine learning, and long-term archival. |
3.4.2 Responsibilities of the data layer: |
Data Ingestion: Receiving large volumes of data streams. |
Storage Solutions: Databases, data lakes, distributed file systems. |
Indexing and Retrieval: Making data accessible for real-time queries. |
Data Governance: Enforcing policies regarding privacy, retention, and access control. |
3.4.3 Technologies in this layer include: |
Relational Databases (SQL). |
NoSQL Databases (Cassandra, MongoDB). |
Time-Series Databases for sensor data (InfluxDB, TimescaleDB). |
Big Data Frameworks (Hadoop, Spark). |
3.4.4 Challenges in the data layer: |
Balancing scalability with performance. |
Ensuring data integrity and consistency across distributed systems. |
Implementing security mechanisms such as encryption at rest. |
3.5 Application Layer |
3.5.1 The application layer provides services and interfaces that end users interact with. It transforms raw and processed IoT data into meaningful insights and actionable intelligence. |
3.5.2 Functions of the application layer include: |
Visualization Dashboards: Displaying sensor readings and analytics. |
Automated Decision Making: Using AI models to recommend or trigger actions. |
User Interfaces: Mobile apps, web portals, or industrial control systems. |
Domain-Specific Services: For example, healthcare monitoring, smart city management, supply chain optimization. |
3.5.3 The application layer is where IoT meets business goals. For instance: |
In healthcare, it provides patient monitoring dashboards. |
In logistics, it optimizes routes and inventory levels. |
In agriculture, it recommends irrigation or fertilization schedules. |
3.5.4 Critical requirements of this layer: |
Security: User authentication, data privacy. |
Scalability: Serving thousands or millions of users. |
Interoperability: Supporting multiple device vendors and standards. |

|
4. Deep Expansion of the Perception Layer |
4.1 Overview of the Perception Layer |
4.1.1 The perception layer is considered the foundation of IoT systems because it directly interfaces with the physical world. Without accurate sensing and data collection, the higher layers of the IoT stack cannot function properly. |
4.1.2 The main role of the perception layer is to perceive the physical environment, gather information, and convert it into digital signals. This transformation is crucial: analog signals like heat, light, or motion must be processed into formats that digital devices and communication networks can handle. |
4.1.3 The perception layer consists of sensors, actuators, RFID technologies, biometric systems, and other embedded devices that detect and interact with the environment. |
4.2 Categories of Sensors Used in IoT |
4.2.1 Environmental Sensors |
Temperature Sensors: Measure environmental or object-specific temperatures. Widely used in agriculture (monitoring soil temperature), HVAC systems, and cold chain logistics. |
Humidity Sensors: Measure water vapor in the air. Critical in warehouses storing sensitive goods such as medicines, textiles, or food products. |
Pressure Sensors: Detect changes in air or liquid pressure. Important in weather stations, automotive systems, and industrial equipment. |
Light Sensors: Used in smart lighting systems and wearable devices to adjust brightness or detect exposure. |
4.2.2 Motion and Position Sensors |
Accelerometers: Measure acceleration forces. Used in smartphones, fitness trackers, and industrial robotics. |
Gyroscopes: Detect angular velocity. Provide orientation information for drones, autonomous vehicles, and gaming controllers. |
Magnetometers: Measure magnetic fields. Often paired with gyroscopes and accelerometers for navigation. |
Proximity Sensors: Detect objects without physical contact. Common in retail stores for customer analytics and in smartphones for screen auto-off. |
4.2.3 Biometric and Health Sensors |
Heart Rate Monitors: Measure pulse using optical sensors. Found in wearables such as smartwatches. |
ECG Sensors: Capture electrical activity of the heart. Used in medical IoT devices. |
Glucose Monitors: Non-invasive or minimally invasive devices for diabetes management. |
Temperature Patches: Wearable skin sensors for patient monitoring. |
4.2.4 Chemical and Gas Sensors |
Carbon Dioxide (CO2) Sensors: Track air quality in smart buildings. |
Carbon Monoxide (CO) Sensors: Ensure safety in industrial environments. |
pH Sensors: Monitor water or soil acidity. |
Gas Leak Detectors: Crucial for detecting methane or propane leaks in factories. |
4.3 RFID and Identification Technologies |
4.3.1 RFID Tags are small devices attached to objects for identification. They consist of a microchip and antenna. Tags can be passive (no internal power, activated by reader) or active (battery-powered, longer range). |
4.3.2 RFID Readers emit radio signals that activate passive tags and capture transmitted data. Readers are deployed in warehouses, retail stores, airports, and hospitals. |
4.3.3 NFC (Near Field Communication) is a subset of RFID that works at very short ranges, typically a few centimeters. Widely used in contactless payments, access control, and identity verification. |
4.4 Actuators in the Perception Layer |
4.4.1 Unlike sensors that collect data, actuators perform actions in response to commands. They are the output mechanism of IoT systems. |
4.4.2 Examples include: |
Motors: Used in industrial machines, drones, and robotics. |
Valves: Control the flow of liquids or gases in smart agriculture and oil pipelines. |
Smart Locks: Used in smart homes and offices for controlled access. |
Heating Elements: Adjust temperature in smart ovens or industrial processes. |
4.4.3 Actuators often work in combination with sensors. For example, a thermostat senses temperature, while the actuator adjusts heating or cooling systems accordingly. |
4.5 Embedded Systems in the Perception Layer |
4.5.1 IoT devices at the perception layer often incorporate microcontrollers (MCUs) or System-on-Chip (SoC) platforms. These provide lightweight processing, initial filtering, and communication with higher layers. |
4.5.2 Common embedded platforms include: |
Arduino boards for prototyping. |
ESP8266/ESP32 for Wi-Fi-enabled IoT devices. |
Raspberry Pi as a bridge between sensors and networks. |
STM32 microcontrollers for industrial IoT. |
4.6 Challenges in the Perception Layer |
4.6.1 Power Consumption |
Many IoT devices are battery-operated. Designing ultra-low-power sensors is critical. Techniques such as duty cycling, energy harvesting (solar, vibration, RF energy), and efficient communication help extend device lifetime. |
4.6.2 Data Accuracy and Calibration |
Sensors must be calibrated to maintain accuracy over time. For example, gas sensors can drift, leading to false readings. |
4.6.3 Scalability |
Deploying thousands or millions of sensors requires consistent standards and interoperability. |
4.6.4 Security |
Devices at this layer are often the most vulnerable to physical tampering. Attackers can replace or manipulate sensors, leading to corrupted data. |
4.6.5 Cost Constraints |
Since IoT often involves large-scale deployments, the per-unit cost of sensors and actuators must remain low. |
4.7 Real-World Examples of the Perception Layer |
4.7.1 Smart Agriculture |
Soil moisture sensors detect water levels. |
Temperature and humidity sensors monitor crop environments. |
Actuators control irrigation valves. |
4.7.2 Smart Homes |
Motion sensors detect presence and adjust lighting. |
Smart locks and actuators secure entryways. |
Indoor air quality sensors monitor pollution. |
4.7.3 Healthcare IoT |
Wearable sensors track heart rate, oxygen levels, and sleep cycles. |
Implantable devices measure glucose or cardiac activity. |
4.7.4 Industrial IoT (IIoT) |
Vibration sensors detect machine faults before catastrophic failures. |
RFID tags track inventory across supply chains. |
|
5. Deep Expansion of the Network Layer |
5.1 Overview of the Network Layer |
5.1.1 The network layer acts as the nervous system of IoT, transporting data collected from the perception layer to higher levels (edge, data, application). Without reliable connectivity, IoT cannot deliver its promised value. |
5.1.2 Its role includes: |
Establishing communication channels between devices. |
Ensuring reliable data transmission with minimal packet loss. |
Providing addressing and identification for millions of heterogeneous IoT devices. |
Maintaining quality of service (QoS) for latency-sensitive applications. |
Implementing security protocols for data in transit. |
5.1.3 This layer is unique in IoT compared to traditional networks because of: |
Massive scale: billions of devices. |
Heterogeneity: different power capacities, communication ranges, and bandwidth needs. |
Mobility: many IoT devices are mobile (vehicles, wearables). |
Energy constraints: many devices rely on batteries. |
5.2 Types of IoT Communication Technologies |
5.2.1 Short-Range Communication |
5.2.1.1 Bluetooth Low Energy (BLE) |
Designed for low-power applications. |
Operates at 2.4 GHz ISM band. |
Range: ~10–100 meters depending on conditions. |
Applications: fitness trackers, smart locks, smart lighting. |
BLE Mesh extends its capabilities for smart building automation. |
5.2.1.2 Wi-Fi |
High data rate, widely available infrastructure. |
Operates on 2.4 GHz and 5 GHz bands, with Wi-Fi 6 introducing support for massive IoT deployments. |
Power-hungry, so unsuitable for ultra-low-power devices. |
Common in smart homes (cameras, smart TVs). |
5.2.1.3 Zigbee |
IEEE 802.15.4-based protocol. |
Low-power, mesh networking support. |
Range: ~10–100 meters per hop, scalable with mesh. |
Applications: smart lighting, industrial monitoring. |
5.2.1.4 Z-Wave |
Proprietary protocol mainly used in home automation. |
Operates in sub-GHz bands (e.g., 908 MHz). |
Excellent wall penetration compared to Wi-Fi and Zigbee. |
Applications: smart locks, thermostats, security systems. |
5.2.1.5 Near Field Communication (NFC) |
Very short range (<10 cm). |
Used in payments, authentication, and access control. |
Energy-efficient but unsuitable for continuous data transfer. |
5.2.2 Long-Range and Low-Power Communication |
5.2.2.1 Cellular IoT |
4G LTE-M (LTE Cat-M1): Optimized for IoT with reduced power consumption and extended coverage. |
NB-IoT (Narrowband IoT): Designed for low-power, wide-area communication with deep indoor penetration. |
5G: Offers ultra-reliable low-latency communication (URLLC) and massive machine-type communication (mMTC). |
Applications: connected cars, smart cities, industrial automation. |
5.2.2.2 LoRaWAN (Long Range Wide Area Network) |
Operates in unlicensed sub-GHz spectrum (e.g., 868 MHz in Europe, 915 MHz in US). |
Provides kilometers of range with very low power consumption. |
Supports star topology with gateways forwarding data to servers. |
Common in smart agriculture, asset tracking, and remote sensing. |
5.2.2.3 Sigfox |
Ultra-narrowband technology. |
Extremely low data rates but high energy efficiency. |
Limited to small messages, ideal for sensors that transmit infrequently. |
Applications: utility meters, environmental monitoring. |
5.2.2.4 Satellite IoT |
Provides connectivity where terrestrial networks are unavailable. |
Used in maritime, mining, oil and gas, and remote agriculture. |
Companies like Iridium, Inmarsat, and Starlink are pushing satellite IoT coverage. |
5.2.3 Wired IoT Communication |
5.2.3.1 Ethernet |
High reliability and bandwidth. |
Still used in industrial IoT environments where wired infrastructure is available. |
Not constrained by power or range, but lacks flexibility for mobile IoT. |
5.2.3.2 Industrial Fieldbus Systems (e.g., Modbus, PROFIBUS) |
Designed for factory automation. |
Provides deterministic, low-latency communication. |
Slowly being integrated with IP-based IoT systems for Industry 4.0. |
5.3 Addressing and Identification |
5.3.1 Each IoT device requires a unique identity to transmit and receive data without conflicts. |
5.3.2 IPv6 is crucial in IoT because: |
It supports ~3.4×10^38 unique addresses. |
IPv4’s ~4.3 billion addresses are insufficient for billions of IoT devices. |
Many IoT networks combine IPv6 with low-power standards like 6LoWPAN (IPv6 over Low-Power Wireless Personal Area Networks). |
5.3.3 Other addressing methods include: |
EPC (Electronic Product Code) for RFID systems. |
MAC addresses for local device identification. |
Unique Device Identifiers (UDIs) in healthcare IoT. |
5.4 Routing in IoT Networks |
5.4.1 Traditional IP routing cannot always meet IoT constraints. IoT requires specialized protocols: |
RPL (Routing Protocol for Low-Power and Lossy Networks): Designed for sensor networks. Builds a destination-oriented directed acyclic graph (DODAG) to optimize paths. |
AODV (Ad hoc On-Demand Distance Vector): Used in ad-hoc IoT deployments like disaster response. |
Mesh Routing in Zigbee and BLE Mesh: Ensures reliable data delivery with redundancy. |
5.4.2 Key considerations in IoT routing: |
Energy Awareness: Routing decisions must minimize energy use. |
Scalability: Networks may scale to millions of nodes. |
Fault Tolerance: Networks must self-heal when nodes fail. |
5.5 Quality of Service (QoS) in IoT Networks |
5.5.1 QoS is critical in IoT because different applications have varying requirements: |
Latency-sensitive applications: Autonomous driving, industrial robotics. |
Reliability-focused applications: Healthcare monitoring, power grids. |
Bandwidth-intensive applications: Video surveillance. |
5.5.2 Techniques to ensure QoS include: |
Traffic prioritization (e.g., medical data prioritized over entertainment). |
Dynamic resource allocation using software-defined networking (SDN). |
Edge caching to reduce repeated requests to the cloud. |
5.6 Security in the Network Layer |
5.6.1 Data transmitted across IoT networks is vulnerable to: |
Eavesdropping: Interception of sensitive data. |
Man-in-the-middle (MITM) attacks: Attacker alters data during transmission. |
Denial of Service (DoS): Overloading IoT gateways or servers. |
5.6.2 Security techniques: |
Encryption (TLS/DTLS for constrained devices). |
Authentication (mutual authentication between device and server). |
Network segmentation (isolating IoT devices from corporate IT systems). |
5.7 Challenges in the Network Layer |
5.7.1 Interoperability |
Devices from different manufacturers often use incompatible standards. Unified frameworks like oneM2M and IoTivity aim to solve this. |
5.7.2 Scalability |
Networks must handle billions of devices, especially with the rise of 5G-enabled IoT. |
5.7.3 Energy Efficiency |
Devices in LPWANs must last 10+ years on a single battery. |
5.7.4 Spectrum Availability |
Unlicensed bands (e.g., ISM) are crowded, leading to interference. |
5.8 Real-World Case Studies of the Network Layer |
5.8.1 Smart Cities |
Barcelona uses LoRaWAN for parking sensors, smart lighting, and waste bins. |
Cellular IoT supports traffic monitoring and public safety. |
5.8.2 Industrial IoT (IIoT) |
Oil rigs use satellite IoT for remote monitoring. |
Factories combine wired Ethernet with wireless Zigbee sensors. |
5.8.3 Healthcare |
Hospitals use Wi-Fi for real-time patient monitoring. |
LPWAN supports tracking of medical assets across large facilities. |
5.8.4 Agriculture |
Farms deploy LoRaWAN sensors for soil and weather conditions. |
Data is transmitted to gateways, then to cloud servers for analytics. |
|
6. Deep Expansion of the Edge Layer |
6.1 Overview of the Edge Layer |
6.1.1 The edge layer represents a pivotal shift in the architecture of IoT systems. Traditionally, IoT devices captured data and transmitted it directly to centralized cloud platforms for storage and processing. However, as IoT scaled to billions of devices, this approach encountered serious bottlenecks in latency, bandwidth, and reliability. |
6.1.2 The edge layer was introduced as a middle ground between the perception/network layers and the data/application layers. By processing information closer to where it is generated, the edge layer ensures that IoT systems can deliver real-time responses, conserve bandwidth, and increase resilience against network failures. |
6.1.3 In the five-layer IoT model, the edge layer is responsible for: |
Local processing and analysis of data before forwarding it upstream. |
Filtering and compression to eliminate redundant or irrelevant information. |
Real-time decision-making, especially in latency-critical applications. |
Temporary storage and caching of data when network connectivity is limited. |
Integration with AI/ML models for inference at the edge. |
6.2 Key Components of the Edge Layer |
6.2.1 Edge Gateways |
6.2.1.1 An edge gateway is a device that sits between IoT devices and the cloud/data center. It aggregates data from multiple sensors and provides computational capacity for preprocessing. |
6.2.1.2 Features of edge gateways: |
Multi-protocol communication (Zigbee, LoRaWAN, Wi-Fi, cellular). |
Onboard compute (ARM processors, x86 CPUs, GPUs). |
Security modules (firewalls, intrusion detection systems). |
Local storage for buffering. |
6.2.1.3 Edge gateways are used in: |
Smart homes (managing lighting, HVAC, and security). |
Industrial IoT (connecting machines and robotics to enterprise systems). |
Smart cities (traffic light controllers, surveillance cameras). |
6.2.2 Edge Servers and Micro Data Centers |
6.2.2.1 Edge servers are small-scale computing clusters deployed close to IoT devices. Unlike gateways, they are capable of handling higher workloads, sometimes hosting containerized applications and virtual machines. |
6.2.2.2 Micro data centers are even larger deployments at the edge, often placed in telecom base stations, hospitals, or factories. They provide: |
Virtualization and orchestration support. |
Redundancy and fault tolerance. |
Local copies of critical services to reduce dependence on central cloud. |
6.2.3 AI Accelerators at the Edge |
6.2.3.1 As AI became integral to IoT analytics, AI accelerators emerged in edge devices. Examples: |
Google Coral TPU for TensorFlow Lite inference. |
NVIDIA Jetson modules for AI-powered robotics and autonomous machines. |
Intel Movidius VPUs for computer vision tasks. |
6.2.3.2 Benefits of AI at the edge: |
Enables real-time decision-making without sending all data to the cloud. |
Reduces bandwidth consumption (only decisions/results are transmitted). |
Increases privacy by keeping raw sensor data local. |
6.3 Functions of the Edge Layer |
6.3.1 Data Filtering and Preprocessing |
6.3.1.1 IoT devices generate enormous amounts of data, but much of it is redundant. For example: |
A temperature sensor may report the same value for hours. |
A video camera may capture static images most of the time. |
6.3.1.2 Edge nodes filter data using techniques like: |
Threshold-based filtering (transmit only when values exceed limits). |
Event-based reporting (send data only when an event occurs). |
Data compression (reduce payload size before transmission). |
6.3.2 Event Detection and Anomaly Recognition |
6.3.2.1 Edge devices can identify critical events in real time. Examples: |
Detecting machine vibration anomalies in predictive maintenance. |
Recognizing unauthorized entry in security cameras. |
Identifying abnormal heart rhythms in wearable medical devices. |
6.3.2.2 Event detection at the edge avoids unnecessary data transfer while ensuring immediate responses. |
6.3.3 Real-Time Decision-Making |
6.3.3.1 Many IoT applications cannot tolerate delays caused by cloud round trips. For example: |
Autonomous vehicles: must detect obstacles and decide within milliseconds. |
Industrial automation: requires sub-second control of machinery. |
Healthcare monitoring: life-critical alarms must trigger instantly. |
6.3.3.2 Edge computing ensures ultra-low latency decisions. |
6.3.4 Local Storage and Caching |
6.3.4.1 Edge nodes often provide short-term storage. Benefits include: |
Resilience when cloud connectivity is disrupted. |
Reduced load on central servers. |
Support for content delivery networks (CDNs) at the edge. |
6.3.4.2 Example: Smart video surveillance systems cache footage locally and upload only key clips to the cloud. |
6.4 Edge Computing vs. Fog Computing |
6.4.1 Edge computing refers to processing at or near the device level. |
6.4.2 Fog computing is a broader concept where data can be processed at any point between the edge and the cloud. Fog nodes may exist at gateways, base stations, or even regional servers. |
6.4.3 Both aim to optimize IoT performance, but edge computing emphasizes ultra-local decision-making, while fog computing focuses on hierarchical distribution of workloads. |
6.5 Benefits of the Edge Layer |
6.5.1 Reduced Latency |
By handling tasks locally, response times are shortened dramatically. |
Autonomous driving, robotic surgery, and industrial control benefit most. |
6.5.2 Bandwidth Optimization |
Instead of streaming all raw data, only summarized or event-driven data is sent. |
Particularly critical in video analytics and environmental monitoring. |
6.5.3 Resilience and Availability |
Systems remain operational even during cloud outages. |
Local decision-making avoids reliance on continuous connectivity. |
6.5.4 Enhanced Security and Privacy |
Sensitive data (e.g., medical records, video feeds) can be anonymized or processed locally before leaving the device. |
6.5.5 Scalability |
Offloading tasks from the cloud reduces central bottlenecks. |
6.6 Challenges in the Edge Layer |
6.6.1 Resource Constraints |
Edge devices have limited power, processing, and memory compared to data centers. |
Running advanced AI models requires optimization. |
6.6.2 Security Risks |
Being physically closer to the environment, edge devices are more vulnerable to tampering. |
They may also lack advanced cybersecurity defenses found in large data centers. |
6.6.3 Management Complexity |
With millions of distributed edge nodes, managing updates, patches, and orchestration becomes challenging. |
6.6.4 Interoperability |
Edge nodes must interact with heterogeneous devices and protocols. |
6.7 Real-World Case Studies of the Edge Layer |
6.7.1 Autonomous Vehicles |
Cars process data from LIDAR, radar, and cameras locally. |
Edge AI systems detect pedestrians, interpret road signs, and make real-time driving decisions. |
6.7.2 Smart Factories |
Edge nodes analyze vibration and temperature of machines in real time. |
Faults are predicted and maintenance scheduled without sending massive datasets to the cloud. |
6.7.3 Healthcare IoT |
Wearables detect arrhythmias or seizures locally and alert caregivers immediately. |
Hospitals deploy edge servers for real-time patient monitoring. |
6.7.4 Smart Cities |
Traffic lights adjust signals based on local traffic data. |
Surveillance systems use edge AI to detect unusual behavior. |
6.7.5 Retail |
Edge computing powers cashier-less stores by analyzing video streams locally to detect purchases. |

|
6. Edge Layer in the Five-Layer IoT Architecture |
6.1 Introduction to the Edge Layer |
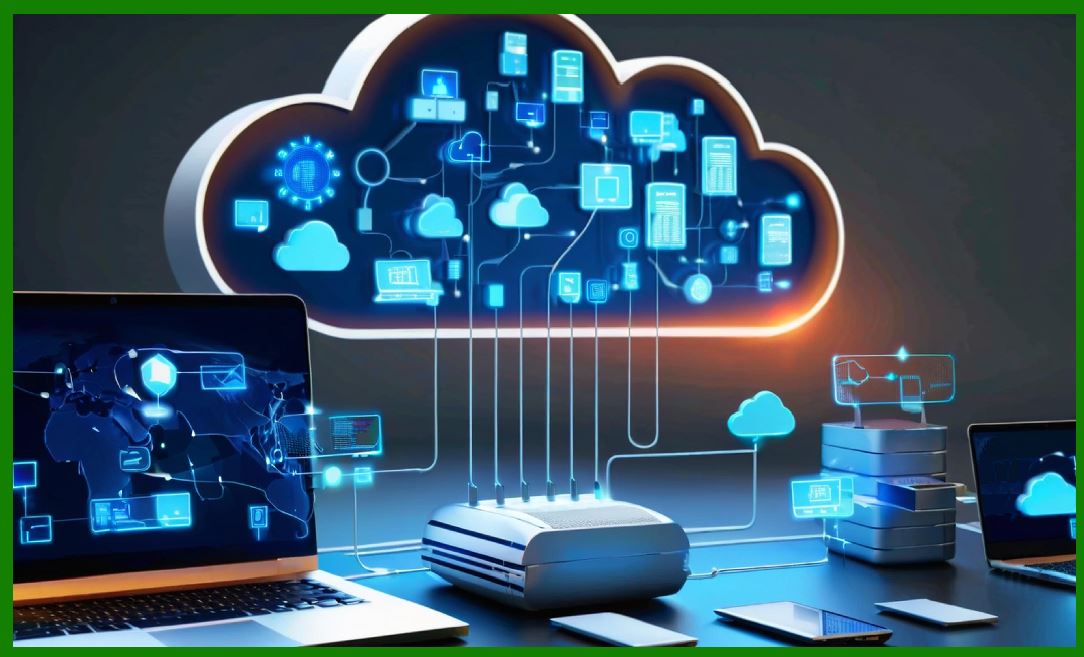
6.1.1 The Edge Layer is often described as the “middle ground” between raw device-level sensing (perception layer) and large-scale centralized cloud computing. Its primary role is to preprocess data near the source, reduce the amount of information that needs to be transmitted to distant data centers, and ensure faster responsiveness. |
6.1.2 The rise of the Edge Layer was largely driven by the realization that not all IoT data is equally valuable. For example, a smart industrial sensor might generate 10,000 vibration readings per second, but only anomalies or aggregated trends are worth transmitting. Without preprocessing at the edge, network congestion and cloud overloading become unavoidable. |
6.1.3 In other words, the Edge Layer is about intelligence at proximity: bringing computation, storage, and analytics as close as possible to where data is generated. |
6.2 Core Functions of the Edge Layer |
6.2.1 Data Filtering and Cleaning |
Raw sensor data is often noisy, redundant, or incomplete. Edge devices apply filters to remove invalid readings and fill missing values. |
Example: A temperature sensor that briefly spikes due to electromagnetic interference can be corrected at the edge without forwarding erroneous values to the cloud. |
6.2.2 Data Aggregation |
Instead of transmitting individual data points, the edge device aggregates them into summaries (e.g., averages, minimums, maximums, standard deviations). |
Example: In smart metering, hourly energy usage statistics can be sent instead of every second-level measurement. |
6.2.3 Event Detection and Local Decision-Making |
Edge nodes detect critical patterns and trigger actions locally. |
Example: In industrial safety, if a vibration sensor detects values exceeding a threshold, the edge system can instantly shut down a machine, without waiting for cloud commands. |
6.2.4 Protocol Translation |
Edge gateways often act as translators between heterogeneous devices. |
Example: A gateway might convert ZigBee device messages into MQTT streams for cloud applications. |
6.2.5 Local Storage |
Temporary caching ensures resilience against connectivity losses. |
Example: In remote farms with intermittent 4G coverage, local gateways store sensor data and synchronize with the cloud once the connection is restored. |
6.3 Key Components of the Edge Layer |
6.3.1 Edge Gateways |
Dedicated devices that connect local IoT sensors to the wider network. |
They handle multiple interfaces (Bluetooth, ZigBee, Modbus, Wi-Fi, Ethernet). |
Examples: Cisco IOx, Siemens IoT2040, Raspberry Pi used as a gateway. |
6.3.2 Edge Servers |
More powerful than gateways, they run applications requiring heavy computation such as video analytics. |
They often use multicore CPUs or GPUs for AI workloads. |
6.3.3 Embedded Edge Devices |
Individual smart sensors that include built-in microcontrollers capable of executing preprocessing tasks directly. |
Example: An ESP32 with TensorFlow Lite Micro running anomaly detection. |
6.3.4 Edge Software Platforms |
Middleware systems that orchestrate tasks at the edge. |
Examples: Azure IoT Edge, AWS IoT Greengrass, EdgeX Foundry. |
6.4 Edge Computing Techniques |
6.4.1 Stream Processing at the Edge |
Real-time data streams are processed locally using frameworks such as Apache Edgent or lightweight custom algorithms. |
Example: Monitoring vibration frequencies in turbines to detect bearing wear. |
6.4.2 Machine Learning at the Edge |
TinyML (Tiny Machine Learning) allows deploying AI models on microcontrollers. |
Example: A motion detector running a trained model to classify human activity (walking, sitting, running) without sending raw video streams. |
6.4.3 Federated Learning |
Edge devices train models locally and only share updates with a central server, preserving privacy. |
Example: Smart home voice assistants improve speech recognition without uploading raw audio. |
6.4.4 Edge Virtualization |
Using containerization (Docker, Kubernetes at the edge) to run multiple workloads on edge gateways. |
This allows dynamic deployment of applications closer to devices. |
6.5 Benefits of the Edge Layer |
6.5.1 Reduced Latency |
Decisions are made locally within milliseconds. |
Critical in autonomous vehicles, robotics, and healthcare monitoring. |
6.5.2 Bandwidth Optimization |
Aggregated or compressed data reduces network load. |
Example: Security cameras transmitting only clips with detected motion. |
6.5.3 Improved Reliability |
Local decision-making ensures IoT systems remain functional even with weak cloud connectivity. |
6.5.4 Enhanced Security |
Sensitive data (e.g., patient health records, financial transactions) can be anonymized or encrypted before leaving the edge device. |
6.5.5 Scalability |
Edge processing prevents cloud bottlenecks as IoT deployments scale to millions of devices. |
6.6 Challenges of the Edge Layer |
6.6.1 Resource Constraints |
Edge devices often have limited CPU, memory, and storage compared to cloud servers. |
Running advanced AI models at the edge requires optimization techniques such as quantization or pruning. |
6.6.2 Security Risks |
Since edge nodes are deployed closer to users and often unattended, they are vulnerable to tampering. |
Attackers may inject malware into gateways, compromise credentials, or physically alter devices. |
6.6.3 Device Heterogeneity |
Different manufacturers use proprietary standards. Interoperability remains a challenge. |
6.6.4 Cost of Deployment |
Edge infrastructure adds extra hardware/software investments compared to purely cloud-based models. |
6.6.5 Maintenance Complexity |
Updating firmware and deploying patches across thousands of distributed edge nodes is logistically complex. |
6.7 Industry Applications of the Edge Layer |
6.7.1 Healthcare |
Wearables preprocess heart rate data, sending only relevant anomalies to doctors. |
Edge-enabled hospital equipment ensures fast alarm triggering. |
6.7.2 Smart Cities |
Traffic cameras analyze vehicle counts and congestion locally before sending metadata to central servers. |
Edge computing in streetlights reduces latency in adaptive lighting. |
6.7.3 Industrial IoT |
Predictive maintenance performed at the edge prevents equipment downtime. |
Factories deploy AI models on edge servers for quality control via computer vision. |
6.7.4 Retail |
Smart shelves detect product removal in real time, update local inventory counts, and synchronize periodically with cloud ERP systems. |
6.7.5 Autonomous Vehicles |
Cars require microsecond-level reaction times; edge computing embedded inside vehicles processes LIDAR, radar, and camera data locally. |
6.8 Future of the Edge Layer |
6.8.1 Integration with 5G and 6G |
Mobile operators are deploying Multi-access Edge Computing (MEC) nodes at base stations to further push processing closer to users. |
6.8.2 AI-Driven Edge Autonomy |
Edge devices will increasingly run advanced models, reducing reliance on centralized AI inference. |
6.8.3 Edge-to-Edge Collaboration |
Instead of communicating only with the cloud, edge nodes may cooperate with each other (peer-to-peer intelligence). |
6.8.4 Green Edge Computing |
Energy efficiency is becoming a priority. Solar-powered and low-power edge designs are being explored. |
6.8.5 Edge Security Enhancements |
Confidential computing, hardware encryption modules, and secure enclaves will become standard at the edge. |
|
7. Data Layer in the Five-Layer IoT Architecture |
7.1 Introduction to the Data Layer |
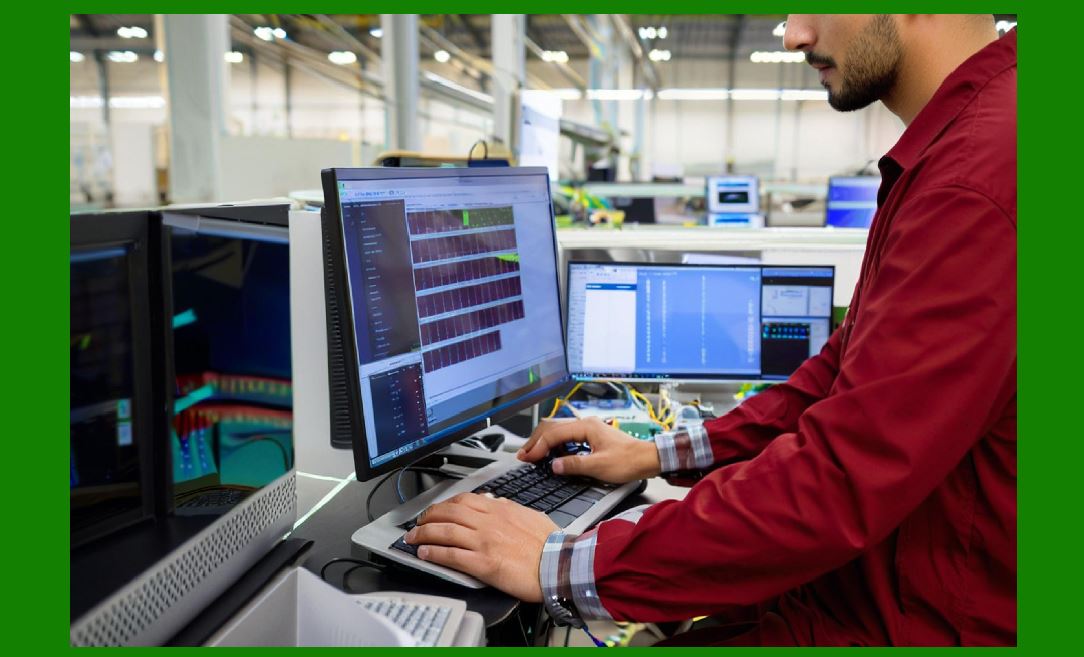
7.1.1 The Data Layer serves as the backbone of IoT ecosystems because it provides the storage, organization, and retrieval capabilities for the huge volumes of information generated by IoT devices. Without an effective Data Layer, the insights from IoT systems would be fragmented, inconsistent, and unreliable. |
7.1.2 This layer typically encompasses: |
Data Lakes for raw, unstructured information. |
Databases (relational and non-relational) for structured access. |
Data Warehouses for analytics-ready transformations. |
Big Data Processing Frameworks for large-scale computations. |
Lifecycle Management Systems to ensure retention, archiving, and deletion policies. |
7.1.3 In IoT, data is not only high-volume but also high-velocity (arriving continuously) and high-variety (heterogeneous formats). The Data Layer must handle these challenges seamlessly while ensuring security, reliability, and accessibility. |
7.2 Characteristics of IoT Data |
7.2.1 Volume |
A single autonomous car can generate terabytes of sensor data per day. |
Smart cities with millions of sensors may generate petabytes annually. |
7.2.2 Velocity |
IoT data often arrives in streams — readings every millisecond, or video feeds at 30 frames per second. |
The Data Layer must capture and store this data without bottlenecks. |
7.2.3 Variety |
Structured: tabular sensor readings (e.g., temperature every minute). |
Semi-structured: JSON messages, logs, or XML. |
Unstructured: video streams, audio recordings, images. |
7.2.4 Veracity |
IoT data can be noisy, incomplete, or duplicated. Systems in the Data Layer must incorporate validation, error detection, and cleansing. |
7.2.5 Value |
The ultimate goal is to extract useful insights. The Data Layer ensures data is prepared for analytics, reporting, and decision-making. |
7.3 Components of the Data Layer |
7.3.1 Data Lakes |
Store raw data in its native format (structured, semi-structured, unstructured). |
Example: Logs, sensor streams, images, and machine status reports. |
Technologies: Hadoop Distributed File System (HDFS), Amazon S3, Azure Data Lake. |
7.3.2 Databases |
Relational Databases (SQL): Best for structured data with predefined schemas (e.g., PostgreSQL, MySQL). |
NoSQL Databases: Handle high scalability and flexible schemas. |
Document-based (MongoDB, CouchDB). |
Key-value stores (Redis, DynamoDB). |
Time-series databases (InfluxDB, TimescaleDB) — ideal for continuous sensor readings. |
7.3.3 Data Warehouses |
Designed for analytics rather than raw storage. |
Data is cleaned, transformed, and structured for business intelligence. |
Examples: Amazon Redshift, Google BigQuery, Snowflake. |
7.3.4 Big Data Processing Frameworks |
Tools like Apache Spark, Flink, and Storm allow distributed processing of IoT data streams. |
Enable real-time analysis (e.g., anomaly detection) and batch processing (e.g., trend discovery). |
7.3.5 Metadata and Indexing Systems |
Metadata describes the stored data (origin, timestamp, type). |
Indexing ensures fast retrieval from massive datasets. |
7.3.6 Data Lifecycle Management |
IoT data cannot be stored forever due to cost and compliance. |
Systems enforce rules: hot data (frequently accessed) remains in fast storage, while cold data moves to archival systems. |
7.4 Storage Architectures for IoT |
7.4.1 On-Premises Storage |
Used in industries requiring strict control (e.g., defense, banking). |
Pros: Maximum control and security. |
Cons: High maintenance costs and limited scalability. |
7.4.2 Cloud Storage |
Most popular approach, leveraging scalability of AWS, Azure, or Google Cloud. |
Supports elastic storage and global accessibility. |
Example: Smart city platforms storing traffic video feeds in the cloud. |
7.4.3 Hybrid Storage |
Combines on-premises and cloud. |
Example: Healthcare IoT — patient records stored on-premises (for compliance), but anonymized analytics data stored in the cloud. |
7.4.4 Edge + Cloud Cooperative Storage |
Data is partially stored/processed at the edge, then synchronized with the cloud. |
Reduces latency while preserving centralized analytics. |
7.5 Data Security and Privacy in the Data Layer |
7.5.1 Encryption |
Data must be encrypted both at rest (storage systems) and in transit (between layers). |
7.5.2 Access Control |
Role-based access control (RBAC) ensures only authorized users/applications can retrieve sensitive IoT data. |
7.5.3 Anonymization and Masking |
Personally Identifiable Information (PII) must be anonymized in compliance with regulations (GDPR, HIPAA). |
7.5.4 Data Integrity Checks |
Hashing and blockchain-based auditing can ensure data has not been altered. |
7.5.5 Compliance and Governance |
Different industries impose strict data retention and usage rules (healthcare, finance, energy). |
7.6 Data Processing in the Data Layer |
7.6.1 Batch Processing |
Processes large datasets collected over time. |
Example: Analyzing seasonal energy consumption in smart grids. |
7.6.2 Stream Processing |
Real-time analysis of incoming data. |
Example: Fraud detection in IoT payment systems. |
7.6.3 ETL (Extract, Transform, Load) |
Extracts data from raw sources, transforms it into structured formats, and loads into warehouses. |
Example: IoT sensor logs converted into structured time-series databases. |
7.6.4 AI and Machine Learning Workloads |
The Data Layer provides training datasets for predictive models. |
Example: Predicting machine failures based on historical sensor data. |
7.7 Industry Use Cases of the Data Layer |
7.7.1 Healthcare |
Storing longitudinal patient data from wearables. |
Combining structured (vitals) and unstructured (MRI scans) data. |
7.7.2 Smart Manufacturing |
Time-series databases record machine telemetry. |
Warehouses store quality control images for AI training. |
7.7.3 Energy and Utilities |
Smart meters send continuous readings to cloud storage. |
Batch analytics identify peak demand periods. |
7.7.4 Retail and E-Commerce |
Data warehouses integrate IoT shelf sensors with sales analytics. |
Customer heatmaps generated from in-store sensors. |
7.7.5 Transportation |
Connected vehicles log driving telemetry for fleet management. |
Airports use IoT luggage tags linked to cloud databases. |
7.8 Challenges of the Data Layer |
7.8.1 Scalability |
With billions of IoT devices, storage must scale elastically. |
7.8.2 Cost Management |
Storing petabytes of IoT data indefinitely is financially unsustainable. |
7.8.3 Data Quality |
Sensor errors, packet loss, and duplicates affect reliability. |
7.8.4 Interoperability |
Different IoT platforms use varied data formats; harmonization is essential. |
7.8.5 Latency in Retrieval |
Real-time applications (e.g., smart traffic lights) cannot wait for slow queries. |
7.9 Future Directions of the Data Layer |
7.9.1 Data Mesh Architectures |
Decentralized approaches where teams manage their own data domains. |
7.9.2 Serverless Databases |
Pay-as-you-go, auto-scaling systems ideal for unpredictable IoT workloads. |
7.9.3 Blockchain for IoT Data Integrity |
Ensures traceability of data records from source to analytics. |
7.9.4 AI-Enhanced Data Management |
Automated anomaly detection in datasets. |
Intelligent tiering between hot/cold storage. |
7.9.5 Quantum Storage and Processing |
In the long term, quantum computing may revolutionize how IoT data is stored and queried. |
|
8. Application Layer in the Five-Layer IoT Architecture |
8.1 Introduction to the Application Layer |
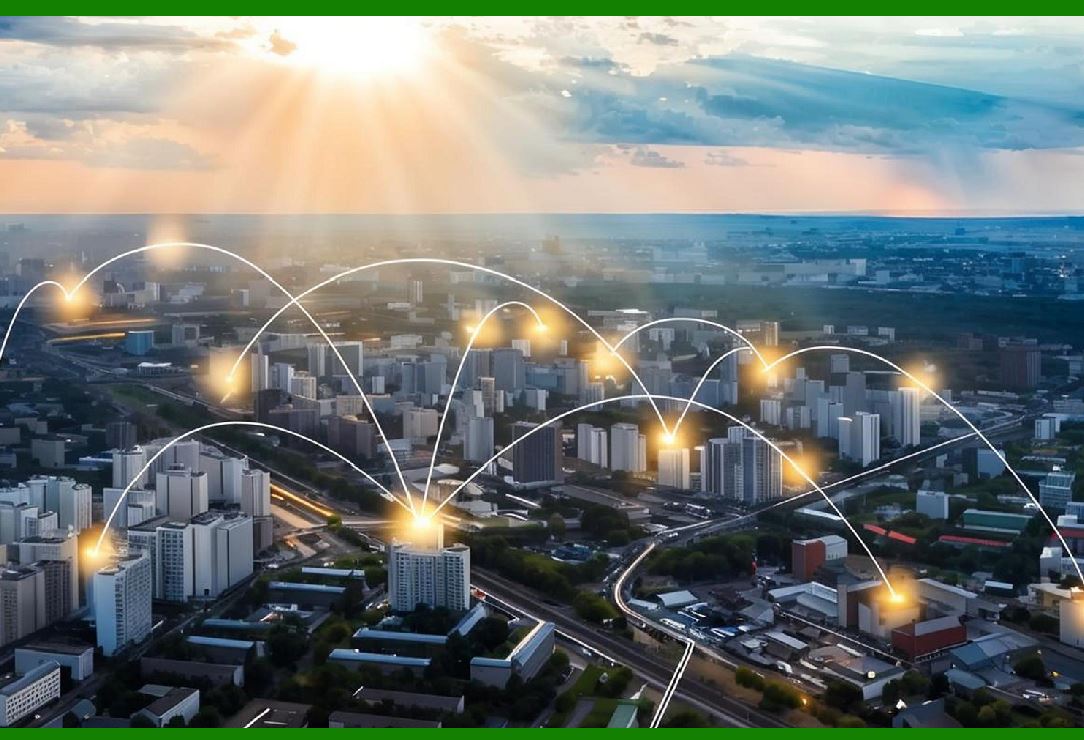
8.1.1 The Application Layer is the face of IoT systems. It provides services, interfaces, analytics, and automation to end-users, businesses, and industry systems. Without this layer, IoT would remain invisible streams of data — the Application Layer translates those into meaningful value. |
8.1.2 Its primary functions are: |
Delivering user interfaces (dashboards, apps, portals). |
Enabling decision-making (business intelligence, predictive analytics). |
Supporting automation (triggering actuators, workflows, policies). |
Providing specialized services tailored to domains such as healthcare, smart cities, manufacturing, and retail. |
8.1.3 This layer directly interacts with human operators, enterprise applications, and even other autonomous IoT systems. |
8.2 Core Functions of the Application Layer |
8.2.1 Data Visualization |
Dashboards display key performance indicators (KPIs), real-time sensor readings, and trends. |
Graphs, heatmaps, and geospatial overlays help interpret IoT data quickly. |
Example: A fleet management dashboard showing live GPS locations of vehicles. |
8.2.2 Analytics and Insights |
Predictive analytics forecast future states (e.g., machine failure). |
Prescriptive analytics suggest optimal actions (e.g., rerouting logistics). |
Real-time analytics power time-sensitive decisions (e.g., fraud detection). |
8.2.3 User Interaction |
Mobile apps and web portals allow end-users to monitor and control IoT devices. |
Example: Smart home apps for controlling lights, thermostats, and locks. |
8.2.4 Automation and Orchestration |
Application logic defines rules and policies. |
Example: “If temperature exceeds 30°C, trigger cooling system.” |
8.2.5 Integration with Enterprise Systems |
IoT application platforms often integrate with ERP, CRM, SCM, and MES systems. |
Example: A retail IoT application updating ERP inventory automatically when smart shelves detect empty stock. |
8.3 Application Layer Architectures |
8.3.1 Service-Oriented Architecture (SOA) |
Applications are composed of reusable services. |
Example: Authentication, device management, analytics as independent modules. |
8.3.2 Microservices Architecture |
Each service (alerting, reporting, visualization) runs independently. |
Benefits: Scalability, resilience, independent deployment. |
8.3.3 Cloud-Native Applications |
Deployed in containers and orchestrated with Kubernetes. |
Enable auto-scaling under fluctuating IoT workloads. |
8.3.4 Platform-as-a-Service (PaaS) for IoT |
Cloud vendors (AWS IoT Core, Azure IoT Hub, Google IoT Core) provide pre-built application services, reducing time to market. |
8.4 Industry-Specific Applications |
8.4.1 Smart Homes |
Control and monitor household appliances remotely. |
Security apps for cameras and locks. |
Energy efficiency dashboards optimizing electricity use. |
8.4.2 Healthcare |
Remote patient monitoring platforms show vitals. |
Predictive analytics warn of potential heart issues. |
Applications integrate with EHR systems for clinician access. |
8.4.3 Smart Cities |
Traffic management dashboards aggregate real-time sensor and camera data. |
Waste management apps optimize collection routes. |
Environmental monitoring applications track air/water quality. |
8.4.4 Industrial IoT (IIoT) |
Predictive maintenance platforms forecast machine breakdowns. |
Digital twins simulate factory conditions. |
Real-time dashboards for production efficiency. |
8.4.5 Retail and Logistics |
Smart shelves notify staff when restocking is needed. |
Supply chain tracking applications provide live shipment visibility. |
Personalized shopping experiences via IoT beacons. |
8.5 User Interfaces in the Application Layer |
8.5.1 Dashboards |
Centralized visualization hubs for operators. |
Customizable for role-based access (managers vs. technicians). |
8.5.2 Mobile Apps |
Provide anywhere, anytime IoT control. |
Example: Mobile apps for wearable health devices. |
8.5.3 Voice Interfaces |
Integration with assistants like Alexa or Google Assistant. |
Example: Voice commands for smart home automation. |
8.5.4 AR/VR Interfaces |
Augmented reality overlays IoT data onto real-world views. |
Example: A maintenance worker sees sensor data projected over a machine. |
8.6 Security in the Application Layer |
8.6.1 Authentication and Authorization |
Ensures only verified users and systems can access IoT applications. |
8.6.2 Data Privacy |
Personally Identifiable Information (PII) must be masked or anonymized. |
8.6.3 End-to-End Encryption |
Prevents interception of sensitive commands (e.g., unlocking doors remotely). |
8.6.4 Multi-Factor Authentication (MFA) |
Adds additional protection against compromised credentials. |
8.7 Application Layer Challenges |
8.7.1 Usability |
Applications must balance complexity with user-friendliness. |
Overly technical dashboards alienate non-experts. |
8.7.2 Integration with Legacy Systems |
Many industries still rely on outdated ERP/MES systems that require custom connectors. |
8.7.3 Data Overload |
If the Data Layer floods the Application Layer with too much raw data, visualization and reporting become overwhelming. |
8.7.4 Scalability |
Applications must support millions of devices/users without performance degradation. |
8.7.5 Security Breaches |
Since this layer is user-facing, it is the most visible target for attackers. |
8.8 Future of the Application Layer |
8.8.1 AI-Powered Interfaces |
Automated insights and decision support via natural language queries. |
8.8.2 Context-Aware Applications |
Apps adapt dynamically based on context (location, time, user behavior). |
8.8.3 Cross-Domain Super-Applications |
Instead of siloed apps (health, home, car), integrated “super apps” will manage multiple IoT domains. |
8.8.4 Immersive Interfaces |
Widespread use of AR/VR to visualize IoT data. |
8.8.5 Hyper-Personalization |
Applications tailoring services to individual preferences using behavioral analytics. |
|
 cs@easiersoft.com