The Barcode Reader Decoded: Principles and Practical Circuit Design in 45 Lessons |
Lesson 1: The Mission of the Reader |
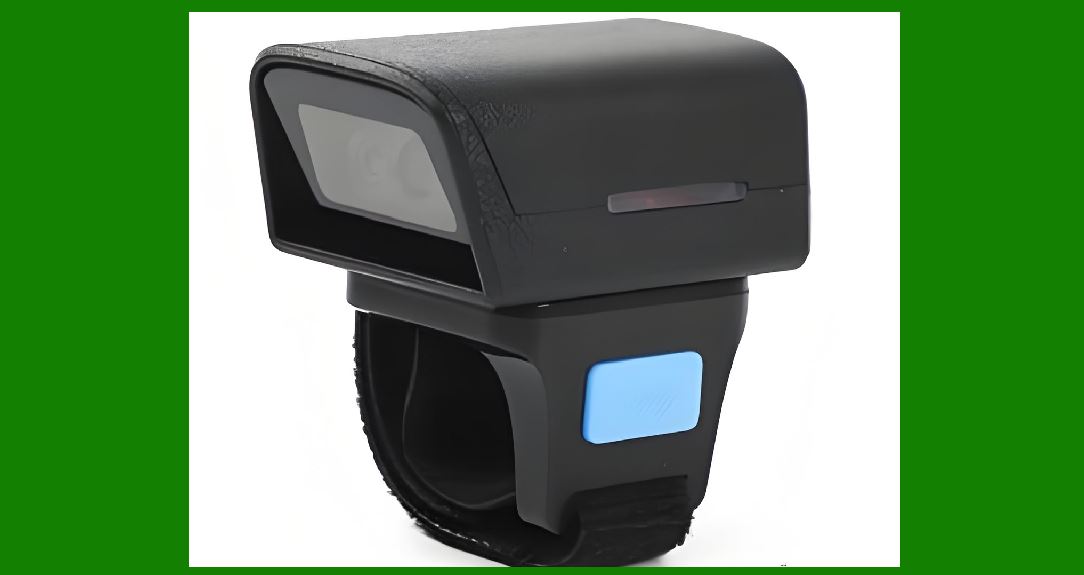
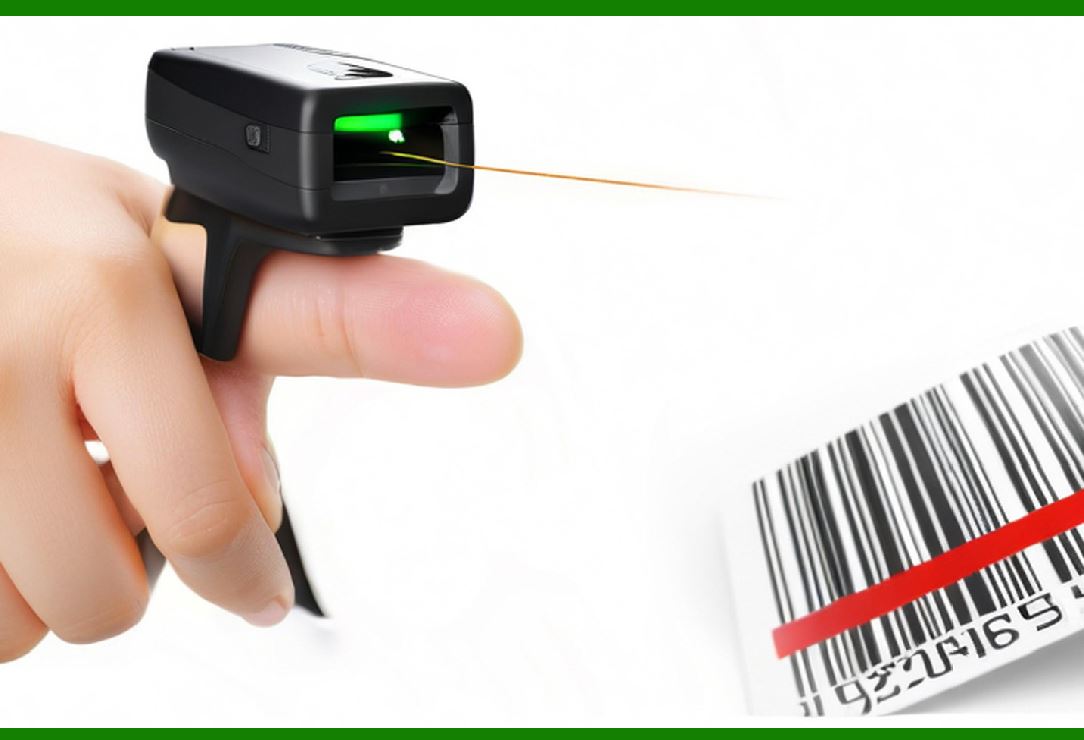
A barcode reader is an opto-electronic system that translates printed parallel bars into electrical signals. Its core task is to extract binary data from a reflective contrast difference. |
Lesson 2: The Signal Chain Overview |
The complete chain is: Light Source --> Target --> Photosensor --> Analog Front-End (AFE) --> Digitizer --> Decoder --> Interface. Each stage adds noise; each stage must be compensated. |
Lesson 3: The Optical Subsystem as a Circuit Element |
The LED or laser diode is not just a lampit is a forward-biased diode whose radiant intensity depends on drive current stability. Thermal drift alters wavelength and intensity. |

|
Lesson 4: Constant Current Drive for Illumination |
Use a current mirror (e.g., transistor pair with emitter degeneration) or a dedicated LED driver IC. Avoid voltage drive; intensity must be independent of battery droop. |
Lesson 5: Pulsed vs. Continuous Illumination |
Continuous is simpler but heats the LED, shifting output. Pulsed operation (10-50 us pulses) reduces heat and improves signal-to-noise ratio (SNR) when synchronised with sampling. |
Lesson 6: The Photodetector Choice |
Photodiodes are preferred over phototransistors for linearity. Phototransistors have higher gain but slower response and severe non-linearity near saturationunsuitable for analog amplitude decoding. |
|
Lesson 7: Photodiode Mode - Photovoltaic vs. Photoconductive |
Photovoltaic (zero bias) offers low noise but slower speed. Photoconductive (reverse bias) reduces junction capacitance, increases bandwidth, but introduces dark current noise. For moving-beam readers, use photoconductive. |
Lesson 8: The Transimpedance Amplifier (TIA) - Heart of the AFE |
The photodiode current is converted to voltage via a TIA. Gain is set by feedback resistor Rf: Vout = Ipd * Rf. Bandwidth is limited by Rf * Cin (photodiode capacitance + op-amp input capacitance). |
Lesson 9: TIA Compensation - The Feedback Capacitor |
Add Cf in parallel with Rf to prevent oscillation. Cf = sqrt(Cin / (2[n] * Rf * GBP)) where GBP is gain-bandwidth product. Rule: start with 2-5 pF, then tune empirically. |
|
Lesson 10: Dark Current Cancellation |
Dark current (nA to uA) appears as an offset. Use a matched reference photodiode (shielded from light) in a differential TIA, or sample the baseline when the LED is off. |
Lesson 11: Ambient Light Rejection - DC Blocking |
Ambient sunlight/fluorescent light creates a huge DC offset. Use a high-pass filter after the TIA (fc [=] 100-300 Hz) to reject 50/60 Hz hum and steady sunlight. |
Lesson 12: Ambient Rejection - Differential Optical Architecture |
Place two photodiodesone signal, one referenceand take their difference. Common-mode ambient light is cancelled; only the modulated reflected signal remains. |
|
Lesson 13: The Modulated Illumination Trick |
Drive the LED with a carrier (e.g., 100 kHz square wave) and synchronously demodulate the photodiode signal using a multiplier or switch. This rejects all uncorrelated ambient light. |
Lesson 14: Synchronous Demodulator Circuit |
Use an analog switch (e.g., 74HC4066) driven by the same clock as the LED. The TIA output is multiplied by (+-)1; low-pass filtering extracts the coherent component. |
Lesson 15: The Gain Stage - Programmable Gain Amplifier (PGA) |
Reflectance varies with distance and paper quality. A PGA (e.g., digital potentiometer + op-amp) lets the microcontroller adjust gain during a calibration preamble. |
|
Lesson 16: Auto-Gain Control (AGC) Loop |
Sample the peak of the analog waveform during the first few bars (quiet zone). Adjust PGA gain so that the peak fits within 80% of the ADC full scale. Done once per scan. |
Lesson 17: The Digitizer - Comparator vs. ADC |
Two routes: (1) Comparator with adaptive threshold --> binary stream direct to decoder. (2) High-speed ADC (8-12 bit, >1 MSPS) --> digital signal processing (DSP) for software decoding. |
Lesson 18: The Adaptive Threshold Comparator |
A fixed threshold fails under varying contrast. Use a peak detector (for high reflectance) and a valley detector (for low reflectance); set threshold = (V_peak + V_valley)/2 via a resistor divider. |
|
Lesson 19: Peak/Valley Detector Circuit |
Use two diode-capacitor circuits with op-amp buffers. One charges to maximum (peak), another to minimum (valley). Include bleed resistors ([=]1 M(Q)) to track slow changes in illumination. |
Lesson 20: Hysteresis in the Comparator |
Add positive feedback (e.g., 10-100 mV hysteresis) to prevent chatter at transitions. The bar edges produce slope-limited signals; hysteresis ensures a single clean transition per edge. |
Lesson 21: Digitizer Output - The Barcode Signal |
The comparator outputs a TTL-level waveform where low = bar (low reflectance) and high = space (high reflectance). The width of each pulse encodes the data (narrow vs. wide). |
|
Lesson 22: The Microcontroller's Role |
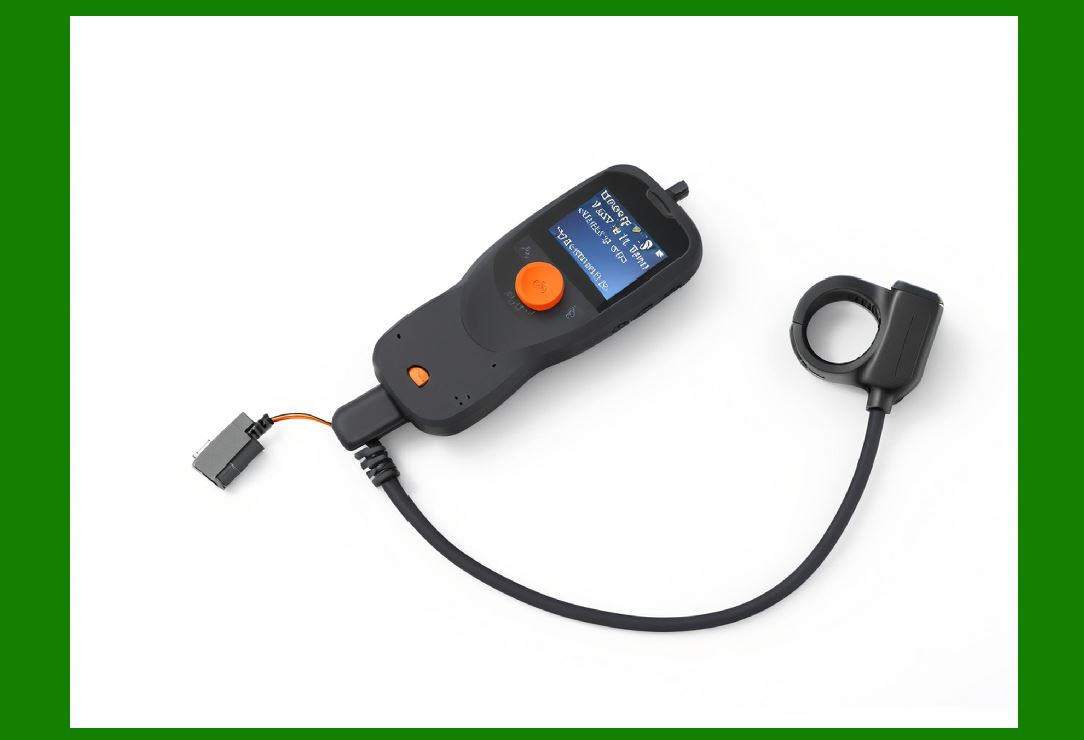
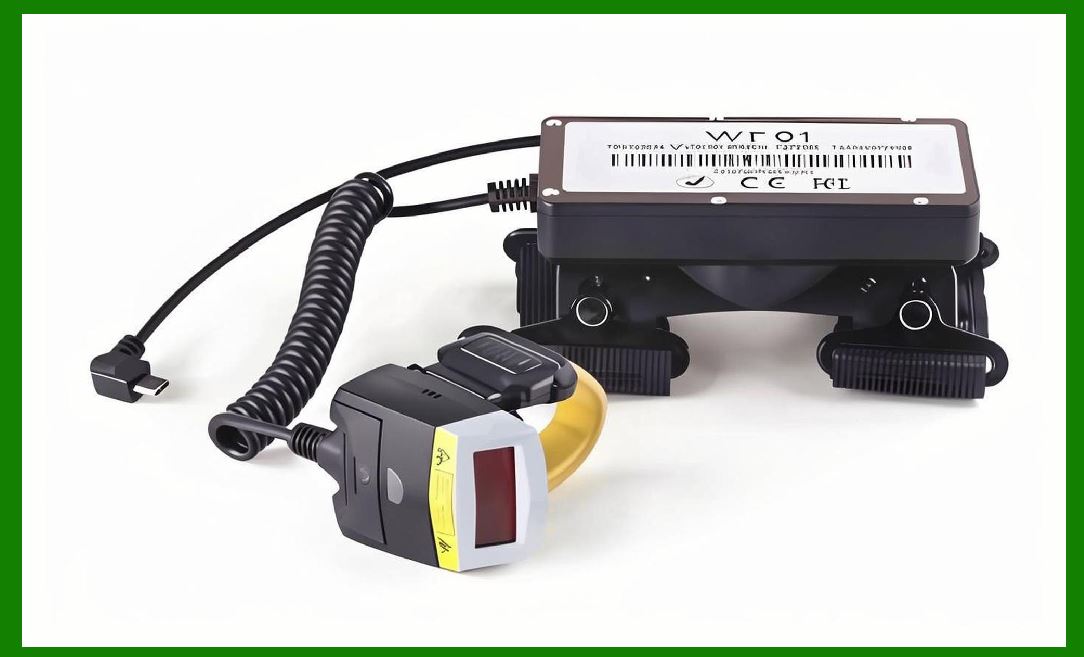
An 8-bit or 32-bit MCU with a timer/capture unit measures pulse widths. It also controls the LED, gain, and communicates the decoded result via UART, USB, or Bluetooth. |
Lesson 23: Timer-Based Width Measurement |
Use input capture mode. Measure time between rising and falling edges with resolution <= 0.5 us. For a typical narrow bar (0.25 mm at 100 mm/s --> 250 us), this yields sufficient count. |
Lesson 24: The Decoding Algorithm - Start/Stop Patterns |
Every symbology has a unique guard pattern. For Code 39, start/stop is '*'. The MCU searches for this pattern; if found, it proceeds to decode the interleaved widths. |
|
Lesson 25: Edge-to-Edge vs. Module-Width Decoding |
Older readers measure absolute widths; better designs measure ratios (e.g., narrow-to-wide ratio = 1:2.5). Ratios are robust to speed variations and tilt. |
Lesson 26: Speed Compensation via Baseline Drift |
If the reader is hand-held, scanning speed varies. Measure the entire scan time; normalize each pulse width by the total symbol length. This converts time widths to module units. |
Lesson 27: Power Supply - The Achilles' Heel |
Digital switching noise from the MCU couples into the analog TIA. Use separate analog and digital ground planes, joined only at the power supply return (star ground). |

|
Lesson 28: Low-Dropout Regulators (LDOs) for Analog |
Supply the TIA and PGA with a dedicated LDO (e.g., 3.3 V, 100 mA) with >60 dB PSRR at 100 kHz. Bypass with 10 uF tantalum + 0.1 uF ceramic near each op-amp. |
Lesson 29: PCB Layout - Short Traces Rule |
The photodiode to TIA input trace must be as short as possible (<10 mm) and shielded by guard rings driven by a low-impedance buffer to reduce leakage and capacitive coupling. |
Lesson 30: Guard Ring Technique |
Surround the high-impedance input node with a copper trace driven by a unity-gain buffer from the TIA output. This keeps the trace voltage equal, eliminating parasitic current leakage. |
|
Lesson 31: Shielding against EMI |
Barcode readers operate near motors and wireless devices. Enclose the analog section in a metal shield tied to analog ground. Add ferrite beads on the LED drive lines. |
Lesson 32: Laser Diode Readers - Extra Complexity |
Laser requires automatic power control (APC) using a monitor photodiode inside the package. A feedback loop adjusts drive current to keep optical output constant over temperature. |
Lesson 33: Laser Scanning - The Moving Mirror |
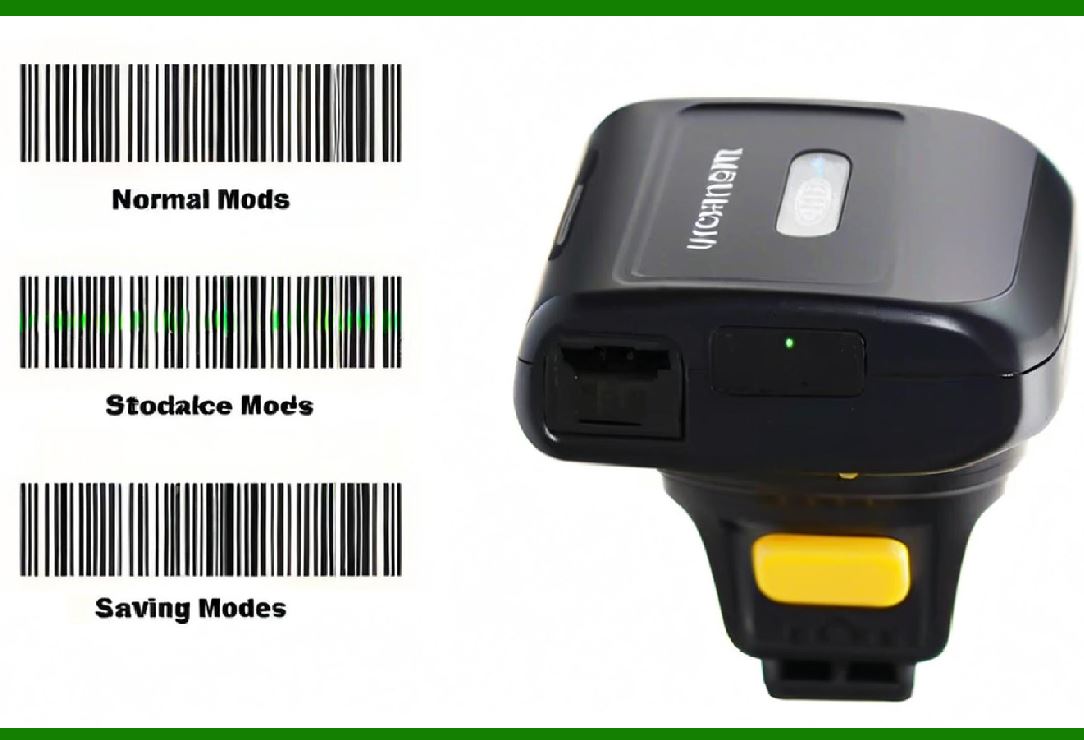
Instead of a linear image sensor, a laser scans via a rotating polygon or oscillating mirror. The photodiode sees a time-domain pulse train. The circuit is identical but with a higher bandwidth TIA (>10 MHz). |
|
Lesson 34: Linear Image Sensor Readers (CCD/CIS) |
For area or linear array sensors, the circuit includes a shift register and sample/hold. The analog output is a video signal with pixels; a correlated double sampler (CDS) removes reset noise. |
Lesson 35: Correlated Double Sampling Circuit |
CDS subtracts the pixel reset level from the signal level using two sample/hold capacitors and a differential amplifier. This reduces 1/f noise and fixed-pattern noise. |
Lesson 36: The Clock Generation Subsystem |
For CCD, generate multi-phase non-overlapping clocks (e.g., 1-10 MHz). Use a crystal oscillator and a programmable logic device (CPLD) or MCU with high-speed timers. |
|
Lesson 37: Decoding via Software - The Match Filter |
Instead of a simple comparator, feed the ADC data into a digital matched filter (correlator) that matches the known bar/space pattern. This improves SNR by 3-6 dB. |
Lesson 38: Baseline Wander Correction |
After AC coupling, long runs of black bars cause the baseline to drift. Implement a digital baseline restorer: sample the minimum value in each scan and subtract it adaptively. |
Lesson 39: Bad Read Recovery - Retry Logic |
If the checksum fails, the MCU changes gain, shifts the LED pulse phase, or re-acquires the trigger. Hardware design must support these reconfigurable parameters via GPIO. |
|
Lesson 40: Example - Discrete TIA Design |
Use the OPA380 (high-speed, low-noise) with Rf = 100 k(Q), Cf = 3.3 pF. Photodiode: BPW34 (reverse bias 5V). Bandwidth [=] 500 kHz. Dark current offset trimmed by a 100 k(Q) potentiometer to Vref. |
Lesson 41: Example - Comparator with Hysteresis |
Use an LMV7219 (fast push-pull). Set threshold via a 10 k(Q) / 10 k(Q) divider from Vref (1.5 V). Add 1 M(Q) from output to non-inverting input for 50 mV hysteresis. |
Lesson 42: Example - Full AFE on a Single Chip |
Consider the MAX3514 or TI's AFE4400 - integrated TIA, PGA, and ADC with ambient cancellation. This reduces part count but requires I2C/SPI configuration. |
|
Lesson 43: Power Budget Estimation |
For handheld: LED pulse (1A * 50 us * 5% duty = 250 uA average), op-amps (5 mA), MCU (10 mA), total [=] 15-20 mA at 3.3V. Use a boost converter if running from a coin cell. |
Lesson 44: Testing and Calibration Procedure |
Use a standard test card (high-contrast). Adjust gain so the peak-to-peak signal = 2.5 V. Adjust threshold so the duty cycle of the digitized output matches the known pattern. Store calibration in EEPROM. |
Lesson 45: Closing - The Elegant Bridge |
The barcode reader is a masterclass in mixed-signal engineeringbalancing optics, analog precision, digital timing, and power. Every design choice, from the TIA's Cf to the decoupling capacitor, determines whether a 1 or 0 is read correctly. Build it, scan it, and iterate. The art lies in the noise floor. |
 cs@easiersoft.com